

In this video I wanted to talk about something I do very often; it’s back testing on a massive scale.
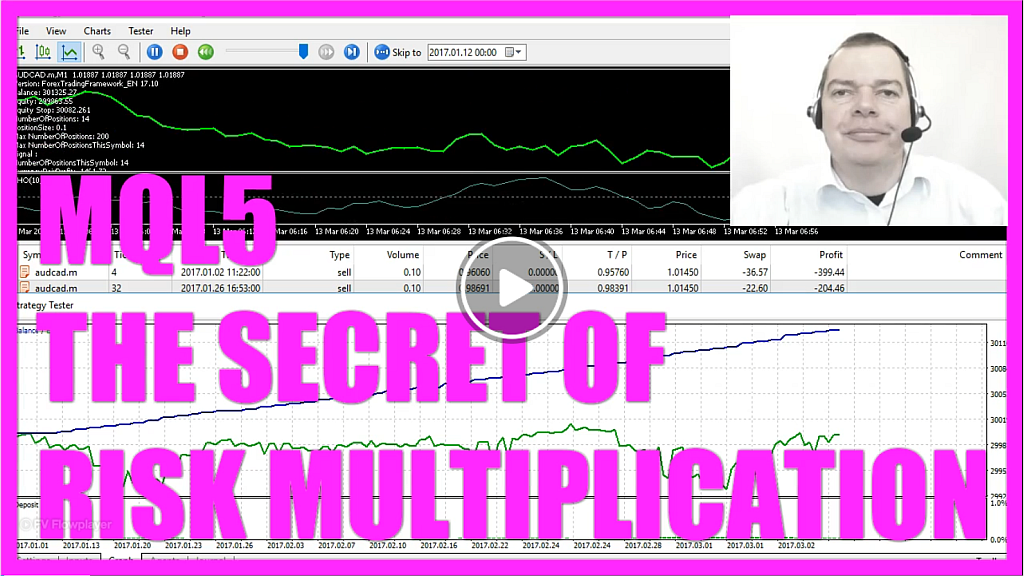
What you see in the background here is the graph for the currency pair, Australian against Canadian Dollar and what I’m looking for is, I like the equity line to be as close to the balance line as possible.
Ideal would be if the green line would be as straight as the blue line here so, my main goal is to find out how to do that because if you have small draw-downs you would need less capital and that would mean that you could make more money with lower risk. You see the green graph below here – that’s the deposit load – it’s below the 1% mark. We started the test with a balance of $300,000 Dollars; right now the balance is above 380,000 Dollars.
Now the test has finished and in our results we would have made 39513 Dollars by trading the Forex Trading Framework for the year 2017.
Now most people would like these kinds of results and I would receive mails from people who ask me to tell them which kind of entry I use.
Well, I use all these entries here and usually I don’t trade for just one year I have already traded all these entries here for seven years. This is a chart that shows ten years for the Australian Dollar against the Canadian Dollar and all these images here represent the result of one of these tests.
This chart is for the BWMFI entry – that’s the Bill Williams Market Facilitation Index – and you see that we have made a good outcome with a very low risk because the green line – the equity – never was below $300,000, so that’s what we are looking for.
This one is for the RSI — and the RSI produced a big draw-down here – we have been lucky because the draw-down also is above the $300,000 mark but if you would see the same draw-down here right in the beginning you would have made a big loss. So, even this system is cashflow positive and profitable human traders would have had a very hard time during the draw-down because that’s where people freak out and close everything to avoid further losses.
Now let’s get back to our system that we have just traded with the cross over entry, now I will out-comment this one and trade the RSI, let’s press F7 to recompile the code and now I go back into Metatrader by pressing F4 or hitting the little button here.
I will now start another test, it’s the same system with a different entry, let’s look at the graph. We are now in February a small draw-down in March, now it’s cashflow positive, in June it’s still rising, we face another drawdown in July, now we are three-quarters through the year; the equity is above $320,000 and now the system is finished and we made 39,513 Dollars, the equity looks okay.
Now let’s change the input for the trading risk to 25, I will disable the visualization and start another test with the exact same system and this time it should go very fast, we are already in March, we already had to draw-downs below $300,000 Dollars, in October we hit the 350,000 equity mark and this is the final result; the total net profit is 57,486 Dollars and now most of you would say; well this is a very good system. Now let’s change the currency pair and try the Euro /US Dollar (EUR/USD) with the same settings, big draw-down here, another one here, now it rises, here comes the biggest draw-down so far, it gets even worse, we are down to 126,000 Dollars and this is the end result: a minus of 146,819 Dollars!
Now, does this mean it’s a bad system?
Let’s change the trading risk from 25 to 4 and start another test. Now we have a much lower risk and the result is positive; it’s a net profit of 3,164 Dollars, so if you are looking to create systems like this you need to adjust your risk settings!
The current Forex Trading Framework has a simple switch for that and this little setting might make the difference between a big loss with huge draw-downs and the equity curve you have always dreamed of.
 Not sure what to do? Click on the automated trading assistant below
OR CLICK HERE TO BUY NOW

- MQL5 TUTORIAL - PLATIN SYSTEM - SIMPLY GOOD PLATIN…
- MQL5 TUTORIAL - BEWARE OF HISTORY QUALITY ISSUES
- MQL5 TUTORIAL - 8900 PERCENT PROFIT ? (Don't do this…
- MQL5 TUTORIAL - HOW TO TRAIN AND SCALE A WORKING…
- MQL5 Tutorial - How to simply count your positions with MQL5
- MQL5 TUTORIAL - TRADING EXPERIMENT 2024 - HOW TO…
