

Introduction to Historical Data in Trading (00:00 – 00:12)
- Introduction to the concept that all historical data in trading is calculated, and a hint at something unusual related to this data.
Observing Inconsistencies in Historical Data Scale (00:12 – 00:27)
- Pointing out an inconsistency in the scale of historical data, with months listed one after the other, and a sudden change in complexity.
Zooming into Chart Data (00:27 – 01:03)
- Demonstrating how zooming into a chart reveals values for each candle, including open, high, low, and close prices, with an example from November 15th.
Hourly Chart Data Analysis (01:03 – 01:22)
- Analyzing a one-hour chart and noticing discrepancies in the data, such as prices for midnight in January.
Data Quality in Different Years (01:22 – 01:57)
- Observing how data quality changes over different years, with an example showing hourly data for 10 o’clock, 11 o’clock, and 12 o’clock.
Quality Issue for Visual Data (01:57 – 02:11)
- Highlighting a quality issue in visual data, where only one candle per day is shown even on an hourly chart, up to the date where the strategy test started.
Testing Data Quality with Euro US Dollar (02:11 – 02:46)
- Conducting a test with the Euro US Dollar pair, showing hourly charts and data available from December 2002, and confirming data quality is okay for trading from February 2003.
Checking History Quality in Strategy Test (02:46 – 03:02)
- Emphasizing the importance of checking history quality in strategy tests, with an example showing a history quality of 99%.
Testing with Australian Dollar Against Canadian Dollar (03:02 – 03:16)
- Conducting a test with the Australian dollar against the Canadian dollar, revealing a history quality of zero, indicating poor data quality.
Conclusion and Importance of Checking History Quality (03:16 – 03:30)
- Concluding the video by stressing the importance of checking the back test tab and the value for history quality every time a strategy test is conducted.
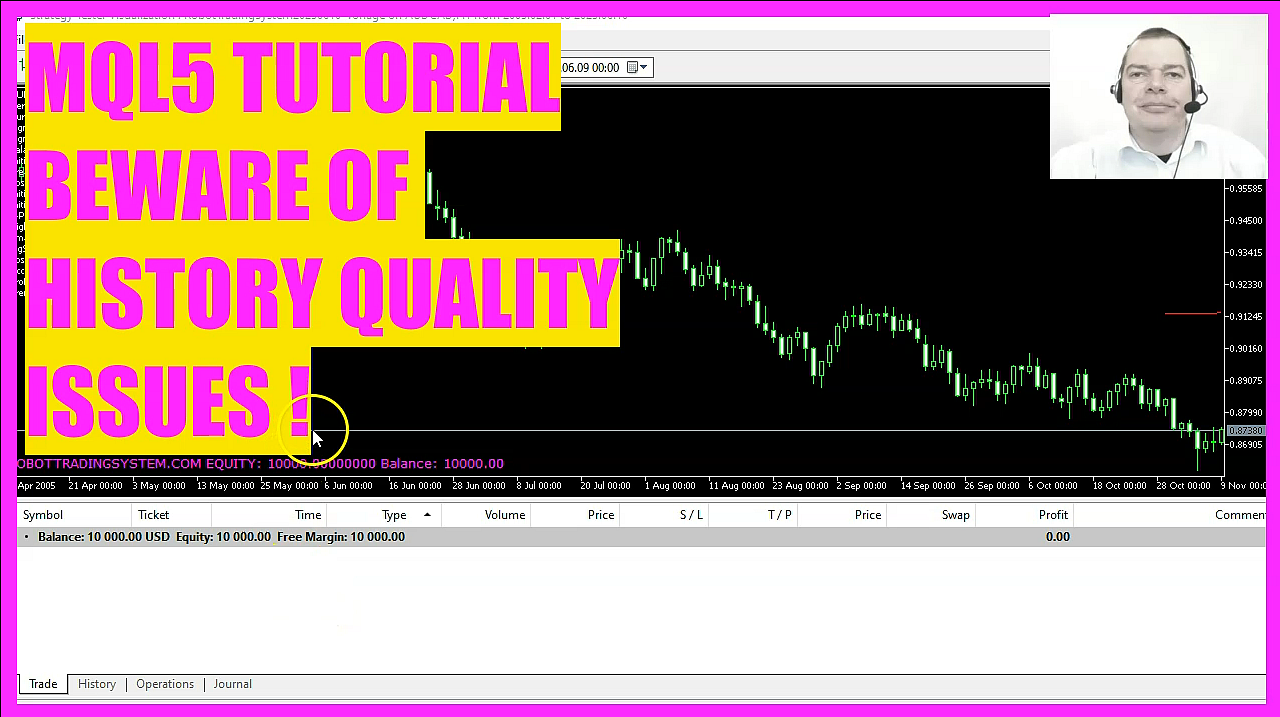
This video, I would like to show you something that you might not know, but you should be aware that all the historical data we see is calculated data, more or less. And I will show you something that is a little bit weird. So if you see the scale here below, we have several months that are listed one behind the other. And suddenly here, we have January the third, January the fourth, and so on. So why is the same scale here much less complex? And that’s because when you zoom into the chart, you will notice that each of those candles here has a value that can be shown when you hover with the mouse over the chart. This is the price for the open, the high, the low, and the close price for November the 15th. And the next candle here will show us the same data for the next day. But actually, we have said that we want to trade on a one hour chart. So what you see with your own eyes here is that for January, we have a price for Midnight. Let’s go a little bit further into the data. This is the next year.
And here suddenly we have a price for 10 o’clock. The next candle is for 11 o’clock, and the next one is for 12 o’clock. That is the way it should be. But actually, when you look at the chart like this one, you might probably not notice that up to the date where we started the strategy test, all the data is just one candle per day. Even we have chosen to trade the hourly chart. So basically, this is a quality issue for visual data. And if we start the test here and zoom into the chart, you will see now we have separate candles for each hour. So data quality might be an issue, especially if you’re trading the early years. Let’s do another test. This time I’m using the Euro US Dollar. Here we are. And if we go back in time, you can see we have hourly charts and data that is available for December 2002. Just remember, we have picked to trade from February 2003. So in this case, the data quality is okay. Now let’s pick the whole year. Let’s set that back to the default and start. Now, we should get a result in a few seconds.
There we are. And it says that the history quality was 99 %. So if you don’t understand why you have bad results, one of the things that you need to check is the history quality. Let’s repeat the whole thing for the Australian dollar against the Canadian dollar. And here it says the history quality is zero. So make sure to check out the back test tab and the value for the history quality every time you do a strategy test. Okay, so far so good. Thank you for watching and I will see you in the next video. Bye..
 Not sure what to do? Click on the automated trading assistant below
OR CLICK HERE TO BUY NOW

- MQL5 TUTORIAL - HOW TO CALCULATE THE HISTORY PROFIT
- The MQL5 Strategy Tester - Is it the Future of Trading?
- MQL5 Tutorial Classics - Simple Moving Average Robot…
- How to create a simple SAR Expert Advisor with MQL5
- MQL5 TUTORIAL - LIVE TRADING EXPERIMENT 2024 - LIVE…
- How to identify doji candles with MQL5
