

- Introduction to SAR Stochastic Standalone Expert Advisor (00:00 – 00:10)
- Introduction to creating an Expert Advisor in MQL5 that uses the Parabolic SAR and Stochastic Oscillator indicators for buy and sell signals.
- Starting with MetaEditor (00:10 – 00:25)
- Instructions on opening the MetaEditor from MetaTrader and the initial setup, including importing the ‘Trade.mqh’ library.
- Setting Up Price Calculation (00:25 – 01:12)
- Explanation of calculating the asking and bid prices using the ‘SymbolInfoDouble’ function and normalizing these prices.
- Preparing Price Data Array (01:12 – 01:29)
- Setting up an array named ‘PriceInfo’ to store price data and sorting it to prioritize the latest data.
- Implementing Parabolic SAR Indicator (01:29 – 02:17)
- Using the Parabolic SAR indicator within the ‘CheckEntry’ function to identify potential buy or sell signals.
- Refining Signals with Stochastic Oscillator (02:17 – 02:45)
- Utilizing the ‘CheckEntryStochastic’ function to refine trading signals based on the Stochastic Oscillator values.
- Executing Trades Based on Signals (02:45 – 03:09)
- Decision-making process for executing buy or sell trades based on the combined signals from SAR and Stochastic indicators.
- Compilation and Testing in MetaTrader (03:09 – 03:38)
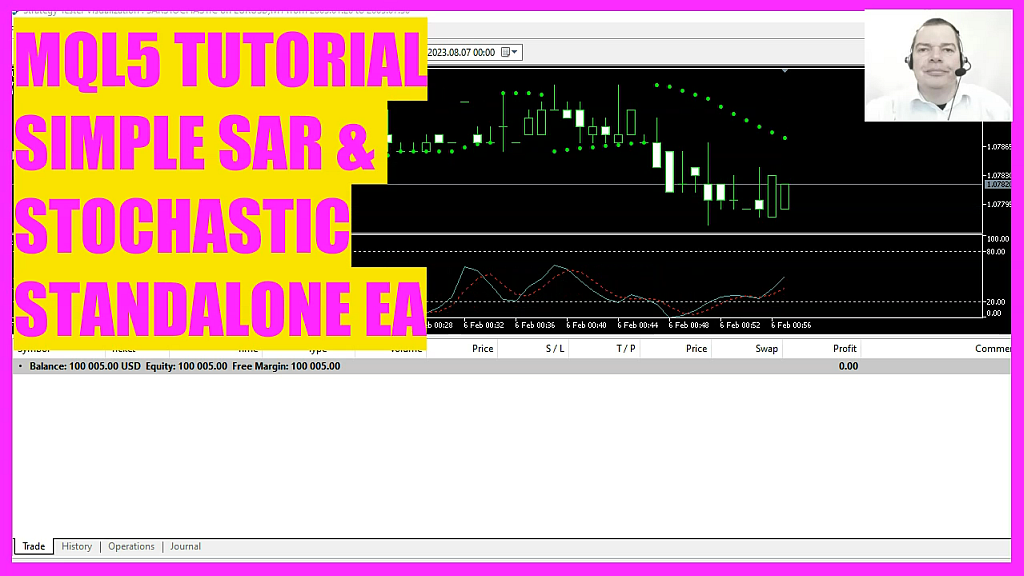
- Instructions for compiling the code and testing the Expert Advisor in MetaTrader using the strategy tester.
- Conclusion and Additional Resources (03:38 – 03:53)
- Recap of the tutorial and an invitation to explore more advanced courses or send ideas for new videos.
In this video, we are going to create an Expert Advisor that uses the Parabolic SAR and Stochastic Oscillator indicators to generate buy and sell signals in MetaTrader. Let’s see how we can do that. First, start the MetaEditor. You can do this by clicking on its icon or simply pressing the F4 key. We begin with the #include directive to import the Trade.mqh library. This library provides us with essential trading functions.
Following this, we create an instance of the CTrade class named trade. This instance will be our primary tool for executing buy and sell orders. Next, we calculate the current asking price using the Symbol Info Double function with the parameters Symbol and SYMBOL ASK. This gives us the price at which we can buy. To ensure precision, we use the Normalize Double function, inputting the price and Digits to adjust the number of decimal places. Similarly, we determine the bid price using the Symbol Info Double function with the parameters Symbol and SYMBOL BID. This is the price at which we can sell. This price is also normalized using the Normalize Double function. We then set up an array named Price Info of type Mql Rates.
This array will store our price data for specific time periods on the chart. Within the On Tick function, we sort our Price Info array using the Array Set As Series function to prioritize the latest data. We then fill this array with price data for the current symbol and time frame using the Copy Rates function. Here, we’re copying data for three candles, giving us a snapshot of recent price movements. The closing price of the most recent candle is then determined using the Price Info[0].close reference. We then call the Check Entry function.
Inside this function, we use the Parabolic SAR indicator to check the current and previous values to determine if there’s a buy or sell signal. If the current SAR value is below the current price and the previous SAR value was above the previous price, it suggests a buy signal. Conversely, if the current SAR value is above the current price and the previous SAR value was below the previous price, it suggests a sell signal. Additionally, the Check Entry Stochastic function is used to refine our signals. This function checks the Stochastic Oscillator values. If the K line crosses the D line from below in an oversold area, it suggests a buy signal. If the K line crosses the D line from above in an overbought area, it suggests a sell signal. With these signals in hand, the code decides whether to execute a buy or sell trade. If both the trading signal and the filter signal return a buy and there are no open positions, the trade.Buy function is used to buy 0.10, equivalent to 10 Micro Lot. If both signals return a sell, the trade.Sell function is used to sell 0.10 Microlot. Once you’ve input all the code, press F7 to compile it.
If this was too fast for you or if you don’t understand what all the code is doing, you might want to check out the Premium course on our website or watch one of the basic videos first. After a successful compilation, return to MetaTrader by pressing the F4 key or clicking on its icon. Once in MetaTrader, press Control and R to start the strategy tester. Select the Expert Advisor you’ve just created, enable the visual mode, and start a strategy test. You should then see the Expert Advisor in action on the chart. If you’re already a Premium course member and have an idea for a video like this one, please send us an email. By the end, you’ll have a deeper understanding of what you’ve learned and the Expert Advisor you’ve coded yourself with just a few lines of MQL code. Thanks for watching, and I’ll see you in the next video!
 Not sure what to do? Click on the automated trading assistant below
OR CLICK HERE TO BUY NOW

- How to combine the Parabolic SAR and the Stochastic…
- How to create a Bollinger Bands Expert Advisor
- MQL5 TUTORIAL - SIMPLE ITRIX STANDALONE EXPERT ADVISOR
- MQL5 TUTORIAL - 134 STANDALONE BOLLINGER MACD EXPERT ADVISOR
- MQL5 TUTORIAL - SIMPLE BEARS POWER STANDALONE EXPERT ADVISOR
- MQL5 TUTORIAL - SIMPLE IDEMA STANDALONE EXPERT ADVISOR
