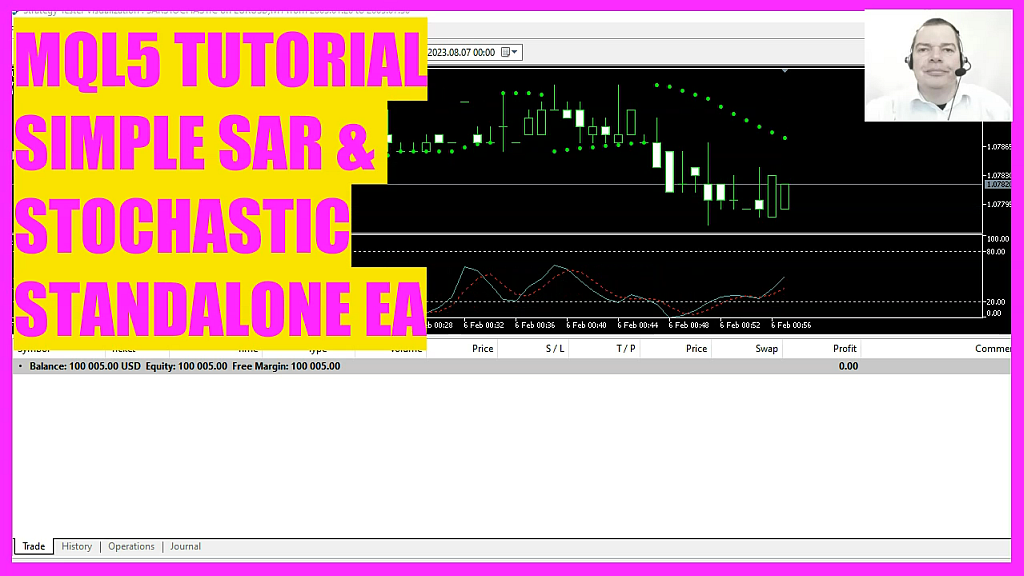
– The video tutorial is about creating an Expert Advisor using the Parabolic SAR and Stochastic Oscillator indicators to generate buy and sell signals in MetaTrader.
– The first step is to create an instance of the CTrade class named trade, which will be our primary tool for executing buy and sell orders.
– To calculate the current asking price, we use the Symbol Info Double function with parameters Symbol and SYMBOL ASK. This gives us the price at which we can buy.
– We sort our Price Info array using the Array Set As Series function to prioritize the latest data.
– The Check Entry function checks the current and previous values to determine if there’s a buy or sell signal.
– The Stochastic Oscillator functions check the K line and D line values to suggest buy or sell signals.
– If both the trading signal and filter signal return a buy, there are no open positions, and the trade.Buy function is used to buy 0.10 Micro Lot.
– If both signals return a sell, the trade.Sell function is used to sell 0.10 Micro Lot.
– Once you’ve input all the code, press F7 to compile it.
– After a successful compilation, return to MetaTrader by pressing the F4 key or clicking on its icon.
– Once in MetaTrader, press Control and R to start the strategy tester.
– Select the Expert Advisor you’ve just created, enable the visual mode, and start a strategy test.
– You should then see the Expert Advisor in action on the chart.
– If you’re already a Premium course member and have an idea for a video like this one, please send us an email.
– By the end, you’ll have a deeper understanding of what you’ve learned and the Expert Advisor you’ve coded yourself with just a few lines of MQL code.
Video Timestamps
- 0:00 – Introduction to creating an Expert Advisor using the Parabolic SAR and Stochastic Oscillator indicators.
- 0:30 – Starting the MetaEditor for MQL5 development.
- 1:00 – Importing the “Trade.mqh” library and creating an instance of the “CTrade” class.
- 1:30 – Calculating the current asking price and bid price.
- 2:00 – Setting up an array named “Price Info” to store price data.
- 2:30 – Sorting the “Price Info” array and filling it with recent price data.
- 3:00 – Using the Parabolic SAR indicator to determine buy or sell signals.
- 3:30 – Refining signals using the Stochastic Oscillator values.
- 4:00 – Executing buy or sell trades based on the generated signals.
- 4:30 – Compiling the Expert Advisor and testing it in MetaTrader.
- 5:00 – Observing the Expert Advisor in action on the MetaTrader chart.
- 5:30 – Encouraging viewers to check out the premium course or basic videos for more understanding.
- 6:00 – Highlighting the benefits of the Expert Advisor and its functionality.
- 6:30 – Conclusion and thanking viewers for watching.
- What is the main topic of the video?
- The video focuses on creating an Expert Advisor that uses the Parabolic SAR and Stochastic Oscillator indicators to generate buy and sell signals in MetaTrader.
- How do you start the MetaEditor?
- You can start the MetaEditor by clicking on its icon or simply pressing the F4 key.
- What is the purpose of the
#includedirective in the code?- The
#includedirective is used to import theTrade.mqhlibrary, which provides essential trading functions.
- The
- How is the current asking price calculated in the code?
- The current asking price is calculated using the
SymbolInfoDoublefunction with the parametersSymbolandSYMBOL_ASK. This gives the price at which one can buy.
- The current asking price is calculated using the
- How is the bid price determined?
- The bid price is determined using the
SymbolInfoDoublefunction with the parametersSymbolandSYMBOL_BID. This is the price at which one can sell.
- The bid price is determined using the
- What is the purpose of the
PriceInfoarray in the code?- The
PriceInfoarray, of typeMqlRates, stores price data for specific time periods on the chart.
- The
- How does the code determine if there’s a buy or sell signal using the Parabolic SAR indicator?
- The code checks the current and previous values of the Parabolic SAR indicator. If the current SAR value is below the current price and the previous SAR value was above the previous price, it suggests a buy signal. Conversely, if the current SAR value is above the current price and the previous SAR value was below the previous price, it suggests a sell signal.
- How does the
CheckEntryStochasticfunction refine trading signals?- This function checks the Stochastic Oscillator values. If the K line crosses the D line from below in an oversold area, it suggests a buy signal. If the K line crosses the D line from above in an overbought area, it suggests a sell signal.
- How does the code decide whether to execute a trade?
- If both the trading signal (from the Parabolic SAR) and the filter signal (from the Stochastic Oscillator) return a buy and there are no open positions, the
trade.Buyfunction is used to buy 0.10, equivalent to 10 Micro Lot. If both signals return a sell, thetrade.Sellfunction is used to sell 0.10 Micro Lot.
- If both the trading signal (from the Parabolic SAR) and the filter signal (from the Stochastic Oscillator) return a buy and there are no open positions, the
- How can viewers further their understanding of the code?
- Viewers who find the video too fast or don’t understand the code can check out the premium course on the website or watch basic videos for a more in-depth understanding.

