

- Introduction to Simple Standalone Bollinger Bands Stochastic Expert Advisor (00:00 – 00:10)
- Introduction to creating an Expert Advisor in MQL5 using Bollinger Bands for signals and the Stochastic Oscillator as a filter.
- Getting Started with MQL5 (00:10 – 00:20)
- Instructions on starting with MQL5, including opening the MetaEditor from MetaTrader.
- Setting Up in MetaEditor (00:20 – 00:31)
- Steps to create a new Expert Advisor file named ‘Standalone Bollinger Stochastic MQ5’ in MetaEditor.
- Importing Trade.mqh and Initializing CTrade (00:31 – 00:56)
- Explanation of importing the ‘Trade.mqh’ file and creating an instance of the ‘CTrade’ class.
- Calculating Ask and Bid Prices (00:56 – 01:24)
- Details on calculating Ask and Bid prices using ‘SymbolInfoDouble’ and normalizing these prices.
- Setting Up Price Data Array (01:24 – 02:03)
- Creating and sorting a price data array using ‘MQL rates’ and ‘ArraySetAsSeries’.
- Implementing Bollinger Bands for Trading Signal (02:03 – 03:44)
- Using Bollinger Bands to define trading signals and filling arrays with data using ‘iBands’.
- Implementing Stochastic Oscillator for Trading Filter (03:44 – 05:00)
- Details on using the Stochastic Oscillator as a trading filter and filling K and D arrays.
- Executing Trades Based on Signals and Filters (05:00 – 07:03)
- Executing trades based on the alignment of trading signals and filters, and checking for open positions.
- Displaying Signals on Chart and Testing in MetaTrader (07:03 – 08:10)
- Instructions for displaying signals on the chart, compiling the code, and testing the Expert Advisor in MetaTrader.
- Conclusion and Demonstration of First Trade (08:10 – 09:10)
- Conclusion of the tutorial with a demonstration of the first trade placed by the Expert Advisor.
This breakdown follows the structure and content of the video, providing a detailed overview of each section along with the corresponding timestamps.
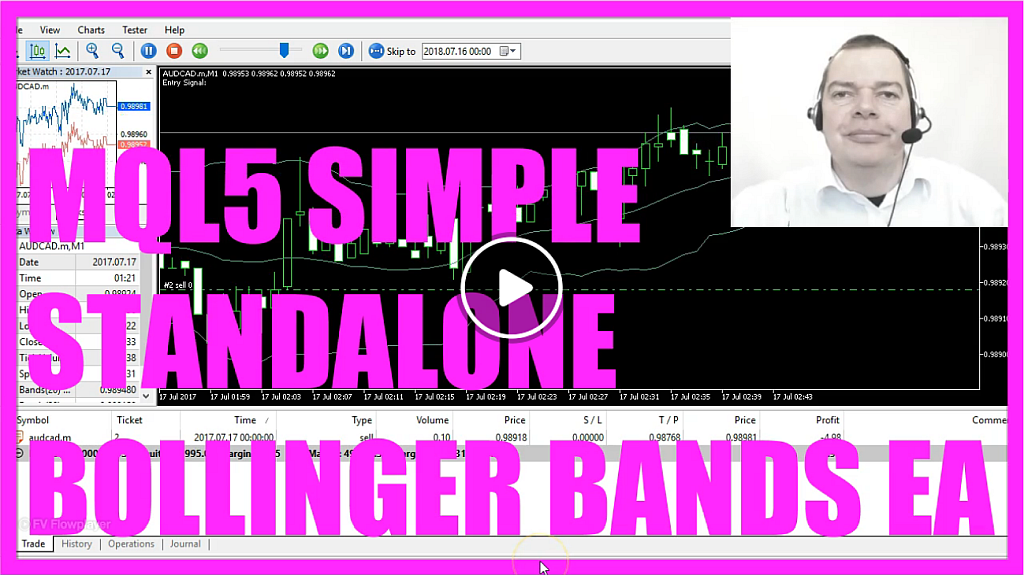
- The video begins with the creation of a Bollinger Bands standalone Expert Advisor that will trade the Bollinger Band signals. A sell trade has already been made, and the tutorial aims to explain how this can be done in MQL5 (0:00).
- The Metaeditor window is opened, and a new Expert Advisor is created from the template. This new Expert Advisor is named “SimpleBollingerBandsStandalone” (8:00).
- The tutorial then proceeds to delete everything above the “OnTick” function and removes the two command lines. The Trade.mqh file is included to create a “CTrade” instance called “trade”, which will be used later to open a position (14:00).
- An empty string called “entry” is created, and the Ask price and the Bid price are obtained using “SymbolInfoDouble” for the current symbol. The “NormalizeDouble” function in combination with “_Digits” is used to get the number of digits for the current symbol of the current chart (22:00).
- An array for the prices called “PriceInfo” is created in the “MqlRates” format. The price array is sorted from the current candidate downwards using “ArraySetAsSeries” (28:00).
- The “CopyRates” function is used to fill the “PriceInfo” array with price data for the current symbol and the currently selected period on the chart from the current candle 0 for 3 candles (35:00).
- Arrays for several prices for the upper and lower band of the Bollinger Bands are created. When the price breaks out and re-enters into the Bollinger Bands, it would be a signal. A buy signal occurs when it does it from below, and a sell signal occurs when it does it from above (39:00).
- The Bollinger Bands are defined by using the built-in “iBands” definition for the current symbol on the chart and the currently selected period. The period of 20 candles, a shift value of 0, and the deviation value of 2 are used, and the calculation is based on the close price (47:00).
- The “CopyBuffer” function is used to copy the “PriceInfo” into the Bollinger Bands definition array. Buffer 1 and buffer 2 are used to calculate the upper and the lower band from the current candle 0 for 3 candles (55:00).
- The Expert Advisor for the current candle is calculated, and the values for the upper and lower band are obtained. To calculate a crossover, the Expert Advisor for the candle before (candle 1) is also calculated (60:00).
- A check is made to see if there is a re-entry from below. This would be true if the close price for candle 0 is above the lower band value and if the close price for the candle before was below the last lower band value. In this case, a buy entry is made (66:00).
- A check is also made to see if there is a re-entry from above. This would happen if the current price is below the upper band value and if the price for candle 1 was above the last upper band value. In this case, a sell entry is made (72:00).
- If the entry equals sell and there are no open positions, a sell of 10 micro lot is made. If the entry equals buy and there are no open positions, a buy of 10 micro lot is made (77:00).
- The “Comment” function is used to output the words “Entry Signal” followed by the calculated entry directly on the chart (85:00).
- The tutorial ends with the compilation of the code and the return to Metatrader. The “SimpleBollingerBandsStandalone.ex5” file is selected in the Strategy Tester, and the visualization option is marked. The test is then started, and the Expert Advisor is shown at work (94:00).
- The video concludes with the explanation of how to automate the Bollinger Bands signal with MQL5 and create a simple standalone Expert Advisor that is actually going to trade with a few lines of MQL5 code (103:00).
 Not sure what to do? Click on the automated trading assistant below
OR CLICK HERE TO BUY NOW

- MQL5 TUTORIAL - 134 STANDALONE BOLLINGER MACD EXPERT ADVISOR
- MQL5 TUTORIAL - HOW TO CREATE THE BOLLINGER BANDS…
- How to create a Bollinger Bands Expert Advisor with MQL5
- How to create an advanced Bollinger Bands entry
- MQL5 TUTORIAL BASICS - 129 SIMPLE BOLLINGER BANDS…
- MQL5 Tutorial - Simple MQL5 Bollinger Bands Robot
