

- Introduction to Bollinger Bands and Expert Advisor Calculation (00:00 – 01:03) Introduction to using Bollinger Bands in trading and how the expert advisor can calculate all three bands with higher accuracy.
- Trading Strategy with Bollinger Bands (01:03 – 01:34) Explaining the trading strategy: opening a short trade when the price breaks the upper Bollinger Band and a long trade when it breaks the lower band and returns.
- Creating an Expert Advisor for Bollinger Bands (01:34 – 02:05) Instructions on creating an expert advisor in MetaTrader to automate trading with Bollinger Bands.
- Setting Up Arrays and Defining Bollinger Bands in Code (02:05 – 03:21) Coding steps to set up arrays for each Bollinger Band and defining the bands based on the current chart and time period.
- Outputting Calculated Values on the Chart (03:21 – 03:38) Using the comment function to output the calculated values of the Bollinger Bands on the chart.
- Compiling the Code and Preparing MetaTrader (03:38 – 04:20) Compiling the expert advisor code and setting up MetaTrader to display the Bollinger Bands on the chart.
- Testing the Expert Advisor in Strategy Tester (04:20 – 05:39) Running the expert advisor in the strategy tester and comparing the calculated values with the chart’s Bollinger Bands.
If you like to use indicators, you might have heard of the Bollinger bands.
This little Expert Advisor here can calculate all three bands.
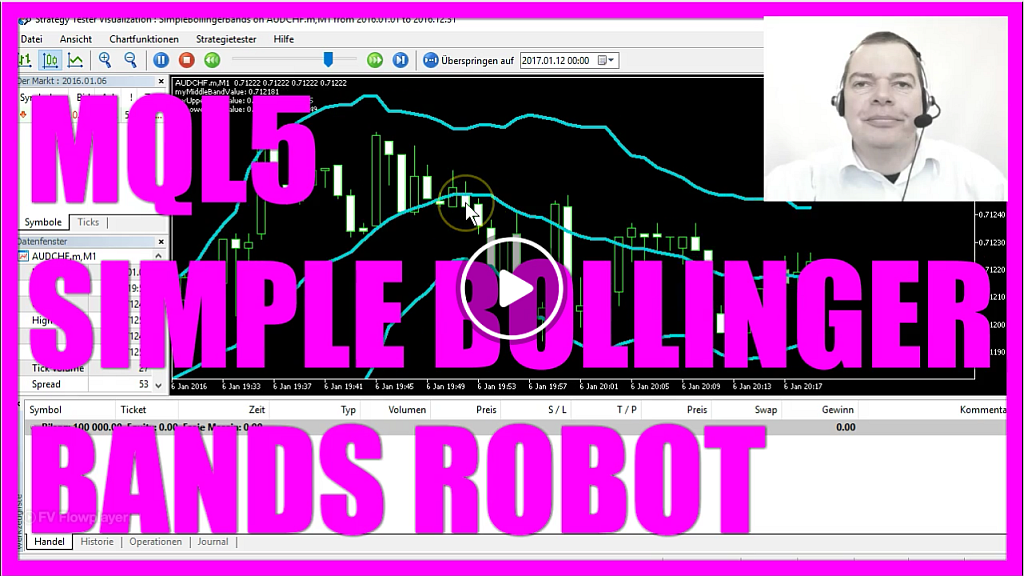
If you put your mouse cursor over the middle band here you see a value of 0.712078 and our calculated value for the middle band is 0.7120775, this calculation even is a little bit more accurate.
The value for the upper Bollinger band is 0.712457 and here we have 0.712457.
And for the lower Ballinger band it’s the same 0711698, 0.7116979.
This value is even more accurate because this one is rounded.
So what can we do with a Bollinger Bands?
Well the idea is as the price breaks the upper Bollinger band we want to get in at the next entry and we would like to open a short trade here, because we expect the price to fall.
In the other case if the price breaks the Bollinger band here and it gets back into the bands we would go for a long trade because the price might rise.
So if you can create an automated Expert Advisor that is able to compare these values over here with the current price, you can fully automate this.
Your computer can trade the Bollinger bands automatically and you don’t have to sit in front of your screen all the time.
So let’s create a little Expert Advisor!
To do that please hit the F4 key or click this little button over here and that will open the Meta Editor.
Here we click on new Expert Advisor from template, continue, we will call it simple Bollinger bands, click on continue, continue, finish.
Remove everything above the OnTick function, remove the comments and the first thing we need is an array for each of the Bollinger bands one, two, three times a double array.
Now we need to sort our three arrays to hold prices from the current candle downwards and we do that with the function arraysetasseries.
In the next step we need to define the Bollinger bands.
We want our Expert Advisor to use the current chart for the current time period used on the chart.
It should calculate the Bollinger bands for twenty candles without any shift and with a standard deviation of two, that all should be calculated for the closed price of the candle.
Afterwards we need to copy the price information into three arrays and now it’s time to calculate the actual value for the current candle and to store it in a variable for each of the three bands.
That’s it for the calculation. Now we want to output our calculated values on the chart, we do that with the comment function and it will output the name of the variable and the value we have calculated in this block.
Okay let’s compile the code. We have no errors and no warnings.
So let’s click the little button over here or hit the F4 key to bring up the Meta Trader, to make the Bollinger band visible on the screen we will use a little trick.
Please click on insert, indicators, Bollinger bands, select the period of twenty candles with a shift value of zero and the deviation value of two, we want to apply all this to the closed price of the candles and now you can pick a color and style for the line.
I prefer these thicker lines. Let’s click on okay and you will see the visual representation of the Bollinger bands on the chart.
Now right click the chart select templates, save template and save it as Tester.tpl to make it the default chart for strategy tester.
And if you save it as default.tpl it will also become the default template if you open a new chart in life trading.
So let’s bring up the Strategy Tester by clicking on View Strategy Tester or hitting the control and the R key and select the simple Bollinger bands.ex5 file, make sure to and enable visualization here and start the test.
And this is what you should see now, let’s stop it here and check the values.
This is 0.706251, 0.7062505, thats okay.
The upper Bollinger band is 0.706916, 0.706916, that’s also okay and the lower Bollinger band is 0.705585, and that’s exactly what’s calculated here, so it works.
In this video you learned to calculate all the Bollinger bands by creating this little Expert Advisor here.
Download “MQL5 Simple Bollinger Bands Expert Advisor from MQL5 Tutorial”
SimpleBollingerBands.txt – Downloaded 614 times – 1.11 KB Not sure what to do? Click on the automated trading assistant below
OR CLICK HERE TO BUY NOW

- MQL5 TUTORIAL - HOW TO CREATE THE BOLLINGER BANDS…
- MQL5 TUTORIAL - PLATIN SYSTEM - BOLLINGER BANDS ENTRY SIGNAL
- How to create an advanced Bollinger Bands entry
- How to create a Bollinger Bands Expert Advisor with MQL5
- MQL5 TUTORIAL BASICS - 129 SIMPLE BOLLINGER BANDS…
- How to create a Bollinger Bands Expert Advisor
