

- Introduction to Bollinger Bands Expert Advisor in MQL5 (00:00 – 00:14)
- Introduction to creating a standalone Bollinger Bands Expert Advisor in MQL5 that trades based on Bollinger Band signals.
- Starting with MetaEditor and Creating a New File (00:14 – 00:39)
- Instructions on opening MetaEditor and creating a new Expert Advisor file named “SimpleBollingerBandsStandalone”.
- Setting Up the Expert Advisor (00:39 – 00:55)
- Removing unnecessary code and including the ‘Trade.mqh’ file for trading functions.
- Initializing Variables and Preparing Price Data (00:55 – 02:04)
- Creating an empty string for entry signals, getting Ask and Bid prices, and setting up an array for price information.
- Defining and Sorting Arrays for Bollinger Bands (02:04 – 03:11)
- Creating arrays for upper and lower Bollinger Bands and sorting them for current price data.
- Implementing Bollinger Bands Calculation (03:11 – 03:53)
- Defining Bollinger Bands for the current symbol and period, and copying price data into arrays.
- Calculating Bollinger Bands Values for Current and Previous Candles (03:53 – 04:53)
- Calculating the upper and lower band values for the current and previous candles to detect crossover signals.
- Determining Buy and Sell Entry Signals (04:53 – 05:44)
- Checking conditions for re-entry from below (buy signal) and from above (sell signal).
- Executing Trades Based on Entry Signals (05:44 – 05:59)
- Selling or buying based on the calculated entry signals, considering open positions.
- Outputting Entry Signals on the Chart (05:59 – 06:13)
- Using the ‘Comment’ function to display the entry signal on the chart.
- Compiling and Testing the Expert Advisor in MetaTrader (06:13 – 06:48)
- Compiling the code and testing the Expert Advisor in MetaTrader using the Strategy Tester.
- Observing the Expert Advisor in Action (06:48 – 07:06)
- Watching the Expert Advisor open trades based on Bollinger Bands signals during the test.
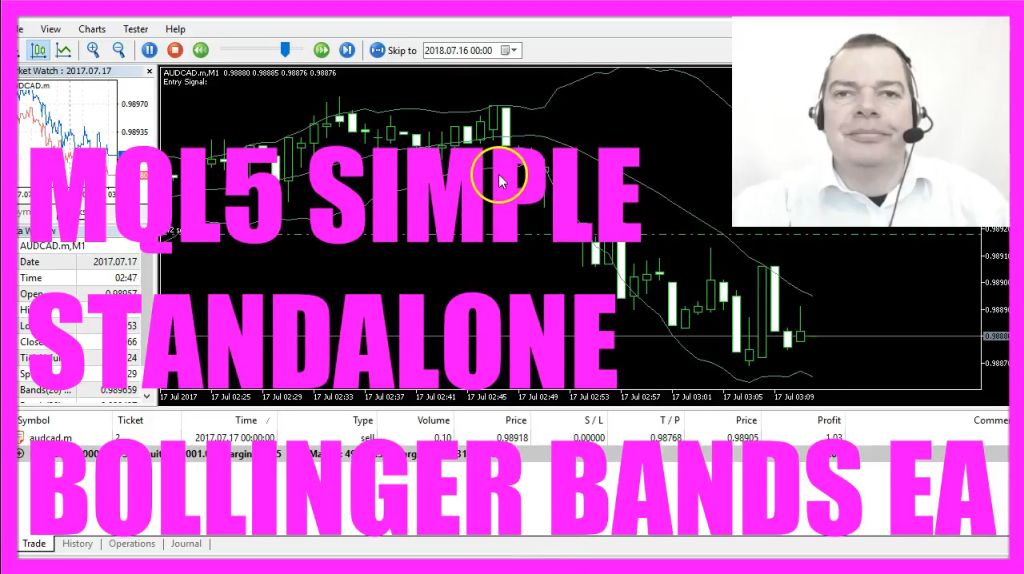
In this video we are going to create a bollinger bands standalone expert advisor that is going to actually trade the bollinger band signals. We have already made a sell trade here and now we want to find out how we can do that in MQL5.
To do that please click on the little button here or press F4 in your Metatrader.
Now you should see the Metaeditor window. And here you want to click on file, New. Expert Advisor from template, Continue.
I will call this one Simple Bollinger band stand alone.
Click on Continue, continue and Finish.
And now you can delete everything that is above the OnTick function and we will also remove the two comment lines here.
First we need to include the trade mqh file.
It will enable us to create a ctrade instance that will be called Trade and we are using it later to open a position. In the Ontick function we first need to create an empty string.
We will call it entry. And we don’t assign a value because we are going to calculate that now.
But before we do that we need to get the ask price and bid price.
That is done by using symbol info double for the current symbol.
We use symbol underscore ask to get the ask price and simple underscore bid to get the bid price.
The normalize double function in combination with underscore digits will help us to get the number of digits for the current symbol of the current chart.
Because we have currency pairs with only three digits and other ones with five digits behind the dot.
We also need to create an array for the prices that will be called price info.
We use MQL rates for that.
MQL rate stores the information about prices like open, high, low and close.
Now we sort the price array from the current candle downwards by using array set as series for our price info.
Array that we have created here.
And after we have done that we use copy rates for our price info array to fill the array with price data for the current symbol and the currently selected period on the chart from the current candle zero for three candles and we store the result in our price info array.
We also need to create an array for several prices for the upper and the lower band of the bollinger bands. This is the upper band, this is the lower band.
And whenever the price breaks out here and reenters into the bollinger bands, that would be a signal.
When it does it from below, that’s a buy signal and when it does it from above like here, that would be a sell signal.
Let’s also use array set as series to sort the upper band array and the lower band array.
And now we actually define the bollinger bands by using the builtin Ibands definition for the current symbol on the chart under currently selected period we will use 20 candles.
If you click on Insert, Indicators, Trend, Bollinger Bands you will see that we use a period of 20 candles.
We have a shift value of zero.
And the deviation value is two. Also what we use here and the calculation will be based on the close price.
Let’s copy the price info into that array by using copy buffer for the bollinger bands definition that we have created here.
Buffer one and buffer two are used to calculate the upper and the lower band from the current candle zero for three candles. And the result will be stored in the upper band array or the lower band array.
Let’s calculate the expert advisor for the current candle. My upper band value will be the value for candle zero in the upper band array. The lower band value will be the value for candle zero in the lower band array.
And to calculate a crossover, we would also need to calculate the expert advisor for the candle before. That is candle 1 and we store the results in the variable my last upper band value and my last lower band value.
Now we want to check if we have a re entry from below.
That would be true if the close price for candle zero – that’s the current price – is above my lower band value, and if the close price for the candle before was below my last lower band value.
In that case we would have a buy entry.
So we assign the word buy to our entry.
In the other case, if we have a re entry from above.
That would happen if the current price is below my upper band value and if the price for candle 1 was above my last upper band value.
In that case we assign the word sell to our entry. And if the entry equals sell and positions total is less than one, that would be the case when we have no open positions, we want to sell ten micro lot.
In the other case, if the entry equals buy and we have no open positions, we want to buy ten microlot.
Last but not least, we want to use the comment function to output the words entry signal followed by our calculated entry directly on the chart.
So that’s it.
Please click on the compile button or press F7 on your keyboard.
This worked without any errors and without any warnings.
So now I can click here or press F4 to go back to MetaTrader.
And in MetaTrader we click on view, Strategy Tester or press Control and R. And in the Strategy tester, please make sure to pick the simple Bollingerbandstandalone ex5 file. Mark the visualization option here and start your test. And here is our little expert advisor at work.
It has already opened a trade here.
And now you know how to automate the bollinger band signal with MQL5 and create a simple standalone expert advisor that is actually going to trade.
And you did it with a few lines of MQL5 code.
SUMMARY:
- The video tutorial demonstrates how to create a bollinger bands standalone expert advisor for trading bollinger band signals using MQL5.
- The process begins by opening the Metaeditor window by clicking on a button or pressing F4 in Metatrader.
- In the Metaeditor window, click on file, New, Expert Advisor from template, Continue, and name the expert advisor “Simple Bollinger band stand alone”.
- Remove unnecessary code and include the trade mqh file to create a ctrade instance called Trade for opening positions.
- Create an empty string called “entry” to calculate the trade signal.
- Obtain the ask price and bid price using symbol info double for the current symbol.
- Normalize the number of digits for the current symbol using the normalize double function.
- Create an array called “price info” to store price data using MQL rates.
- Sort the price array in descending order using array set as series.
- Use copy rates to fill the price info array with price data for the current symbol and selected period.
- Create arrays for the upper and lower band prices of the bollinger bands.
- Sort the upper and lower band arrays using array set as series.
- Define the bollinger bands using the built-in Ibands definition for the current symbol and selected period.
- Copy the price info into the bollinger bands arrays using copy buffer.
- Calculate the current and previous upper and lower band values.
- Check for buy or sell signals based on re-entry from below or above the bands.
- Open a position to buy or sell if there are no open positions and the entry signal is valid.
- Use the comment function to display the entry signal on the chart.
- Compile the code without errors or warnings.
- Return to MetaTrader and open the Strategy Tester.
- Select the Simple Bollingerbandstandalone ex5 file, enable visualization, and start the test.
- The expert advisor will automatically trade based on the bollinger band signals.
 Not sure what to do? Click on the automated trading assistant below
OR CLICK HERE TO BUY NOW

- MQL5 TUTORIAL - HOW TO CREATE THE BOLLINGER BANDS…
- How to create a Bollinger Bands Expert Advisor
- MQL5 TUTORIAL - 134 STANDALONE BOLLINGER MACD EXPERT ADVISOR
- MQL5 Tutorial - Simple MQL5 Bollinger Bands Robot
- How to create an advanced Bollinger Bands entry
- How to create a Bollinger Bands Expert Advisor with MQL5
