

In this video, we want to talk about back-testing and how we can speed up the whole process.
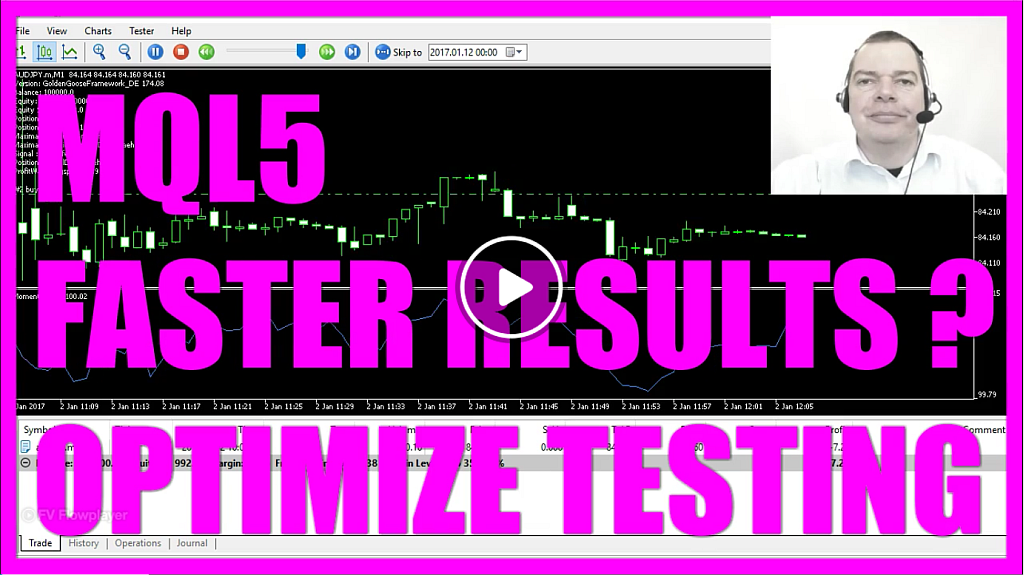
Right now, we are back-testing the momentum indicator and we are using the Golden Goose Framework for it.
It takes some time.
We have just reached January 2nd, we can speed up the process here but it still takes a long time until our test is finished.
One way to speed up the process of testing is to change the kind of data we are testing.
Most people believe that Every Tick would be the most accurate option but if you go to the website: mql5.com, you will see that they are generated and the generation is based on support points.
If you are really interested you can read the whole article but most of the time I use 1 min OHLC; that’s open/high/low and close prices. That will really speed up the back-testing process and the data quality is high enough to test almost every system you can think of.
A second way to speed up the process is to disable the visualization here by removing the check mark.
In that case only a graph is generated and this is much faster because Metatrader doesn’t have to process all the price data for each and every candle on the chart. You will still be able to compare the results on the results tab and if you do a right click here and select report: html, you can select a file name, save the file and a few seconds later you can open your html file that will not only contain the results.
You can also see valuable information displayed in this infographics here and below that you will see each and every trade you made with all the details and because you saved that file you will be able to compare it to other files to see if you can get better results.
But with Metatrader 5 you will be able to optimize your test even more. Just click on optimization and select: All symbols selected in Market watch. This is the market watch window and I have all these symbols here and when I click start I will have a new tab here saying: Optimization Results and Optimization Graph.
As you see Metatrader already has done 8 out of 14 currency pairs and in a few seconds, we get a result here. It will show you the profit results here. With a right click you can export it to XML and the best thing is that you can open these XML files with Microsoft Excel or in my case I will use the Libre Office and all I need to do is to click in this cell in here and select sum and now I see that the end result for the first three months of 2017 would have been in the profit.
Now I expand my test and go for half a year. This also shouldn’t take very long.
Let’s export the second report, I will call this one MyXMLReport2. Let’s open it with the Libre Office calculation tool. Select the cell. Click on the sum symbol and this time we would have made 3647 dollars.
Okay.
Now you know how you can test forty different currency pairs by using: All symbols selected in MarketWatch. This will save you lots of time if you have to test several years for a dozen currency pairs or more.
 Not sure what to do? Click on the automated trading assistant below
OR CLICK HERE TO BUY NOW

- How to create an advanced Bollinger Bands entry
- MQL5 Sales Page
- Learn Automated Trading with MQL5
- The MQL5 Strategy Tester - Is it the Future of Trading?
- MQL5 TUTORIAL GRUNDLAGEN - 130 HOW TO IMPROVE YOUR…
- MQL5 TUTORIAL - HOW TO GET THE 1000 PLATIN SYSTEM FOR FREE
