

In this video, we are going to calculate the standard deviation value for two hundred candles, so let’s find out how to do that with MQL5. To get started, please click on a little icon here or press F4 on your keyboard.
Now you should see the Metaeditor window and here you want to click on file, new file, Expert Advisor from template, continue. I will call this file simple standard deviation. Click on continue, continue and finish. Now you can delete everything above the ontick function and let’s also remove the two comment lines here. We start with an include statement to include the file Trade.mqh. This one comes with some simplified trading functions. And we create an instance of the class Ctrade and call it trade. Inside of the ontick function, we want to create a variable for the signal.
But we are not going to assign any value, because we are going to calculate that later. Afterwards, we want to calculate the Ask price and the Bid price, that is done by using Symbolinfodouble for the current symbol on the chart, we use either symbol underscore, ask or underscore bid. And with normalize double and underscore digits, we make sure that we calculate the right number of digits behind the dot. Let’s continue and create an array for the standard deviation Expert Advisor.
We can use the integrated function iSTDDEV for the current symbol on the chart and the currently selected period on that chart.
We want to calculate the results for twenty candles, without any shift for a simple moving average. That is why we use ModeUnderscoreSMA and the result should be calculated based on the close price. Now we use arrays set as series to sort our array from the current candle downwards.
And with copybuffer we fill our standard deviation array according to the definition that we have created here for buffer zero.
We start with the current candle zero and we will copy the values for two hundred candles. So let’s actually write that in the comment. That makes it possible to now calculate the highest candle number by using array maximum. Array maximum will give us the largest element in our array and actually that is the candle number, not the value. We want to search in the standard deviation array starting from Candle zero and we want to search in the whole array. Let’s also do that for the lowest candle number, that can be calculated by using array minimum.
The rest is the same and we need one more thing, and that is the standard deviation value for the current candle.
We get that one by using Normalize double for the standard deviation array. We want the value for candle zero with six digits behind the dot. Now we can check if the lowest candle number equals zero.
That would mean that the deviation value for candle zero is the lowest of two hundred candles. If that is the case we consider that to be a buy signal. So we assign the word buy to our signal. Otherwise, if the value for candle zero is the highest, that would mean we have a sell signal and now we assign the word sell to our signal. And if we have a sell signal and the return value for PositionsTotal is below one, that would mean that we have no open positions and a sell signal. And now we use trade.Sell to sell 10 Microlot. In the other case, if the signal equals buy and we also have no open positions, that’s when we use trade.Buy and by 10 Microlot.
Finally we add a comment statement that will output the current deviation value, the number of the highest and the lowest candle and the calculated signal. That’s about it, if this was too fast for you or if you have no idea what all the code here does, you maybe want to watch one of the other videos in the basic video series. Or maybe even the Premium Course might be interesting for you. You can find that one on our website. And that’s also where we now have some offers for source codes for the basic videos like this one.
For now, please click on View, toolbar and press the compile button or press F7 on your keyboard.
You shouldn’t get any errors here. And if that is the case, you can click on a little button here or press F4 to go back to Metatrader. And in Metatrader we click on View, Strategy tester or Control and R.
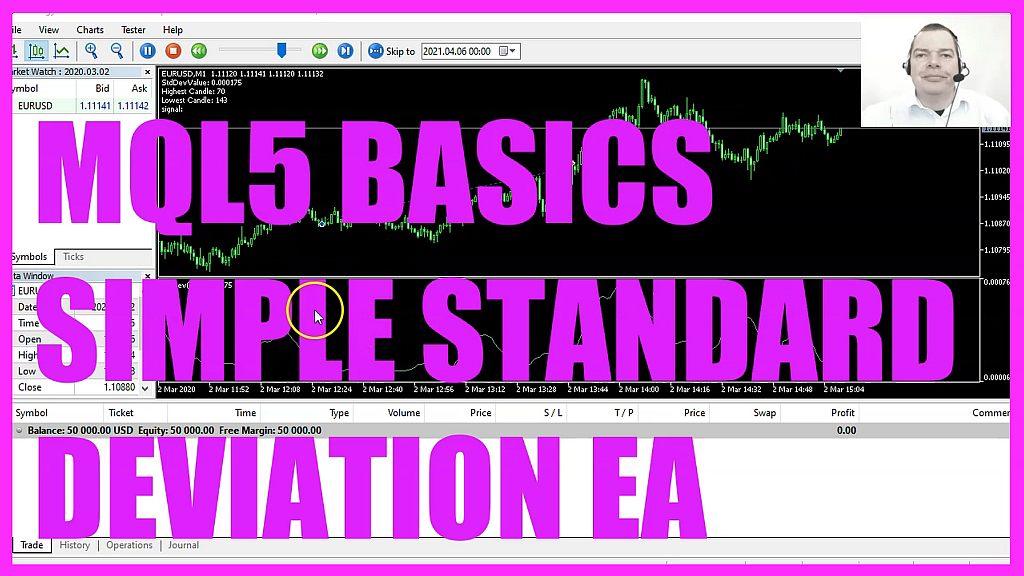
Please pick the new file simple standard deviation.ex5, mark the option for the Visual mode here and start your test. Here we are, the Expert Advisor is running. And as soon as one of those values here is for candle zero, we should see our first trade. That happened right now. So our little Expert Advisor is working as expected. And in this little video you have learned how to calculate the standard deviation value with MQL5. And you have coded it yourself with a few lines of code in the Metaeditor.
 Not sure what to do? Click on the automated trading assistant below
OR CLICK HERE TO BUY NOW

- MQL5 TUTORIAL BASICS - 116 SIMPLE ENVELOPES SELL…
- MQL5 TUTORIAL BASICS - 115 SIMPLE ENVELOPESBUY TRAILING STOP
- MQL5 TUTORIAL BASICS - 126 SIMPLE RUNNING TIMER
- MQL5 Tutorial - Simple MQL5 Bollinger Bands Robot
- MQL5 TUTORIAL BASICS - 114 SIMPLE SHIFTED PRICE EA
- MQL5 TUTORIAL BASICS - 117 SIMPLE MULTIPLE CHART TREND
