

In this video we are going to create an expert advisor that is able to identify trends on different charts. So let’s find out how that can be done for MQl5. To get started please click on a little icon here or press f4 on your keyboard. Now you should see the Metaeditor window and here you want to click on File, new File, Expert Advisor from Template, continue. I will call this file simple multi chart trend.
Click on continue, continue and finish. Now you can delete everything above the Ontick function and let’s also remove the two comment lines here. We want to start by creating an array for the price information, that can be done by using MQL rates. The name of the array will be priceinfo. Afterwards we use Array set as series to sort our price information array from the current candle downwards, and now we use copyrates to file it for the current symbol on the chart and the currently selected period on that chart, starting with the current candle zero and we will store the values for three candles in our price info array.
Now we want to create two variables. One is called chart signal and the other one is called Euro USD signal. We don’t assign any values here. Let’s continue and create two arrays. One is called EMa 20 array.
The other one is EMA Euro US Dollar 20 array. And now we can use the integrated IMA function that comes with MQL5 for the current symbol on the chart and the currently selected period on that chart. To calculate the exponential moving average for 20 candles, we don’t use a shift value here. This parameter is called Mode EMA, that stands for exponential moving average, and the result should be calculated based on the close price. Let’s continue and this time we are doing it in a similar way, but the first parameter is hard coded for the Euro US dollar.
If you click on the symbol in the market watch, you will see a name, that might be a different name depending on your broker and your account type. So please make sure that you pick the right one. Everything else is similar. So now we can use array set as series for both arrays to sort them from the current candle downwards. And now we use copy buffer for both arrays, the one for the current symbol on the chart and the other one for the Euro US dollar to fill them for buffer zero, starting from the current candle zero for three candles.
And now we can check the trend. We want to check if the current candle zero is bigger than candle two for the EMA 20 array. If that is the case, the signal for a current chart is buy. Otherwise, if the value for candle zero is below the one for candle two, that would be a sell signal for the current chart, and this part is basically the same, but for the hard coded Euro US dollar. Finally, we add a comment statement to output the values for the EMA 20 for the current symbol, the EMA 20 for the Euro US dollar, the trend for the current symbol and the trend for the Euro US dollar, and that’s about it.
Well, if this was too fast for you or if you have no idea what all the code here does, you maybe want to watch one of the other videos, or maybe even the premium course on our website might be interesting for you. There you can also find some links for source code downloads like this one and a shop link. For now we are done. Please click on compile or Press F7 on your keyboard. You shouldn’t get any errors, and if that is the case, you can click on the little button here or press F4 to go back to Metatrader. And in MetaTrader, please pick an empty chart.
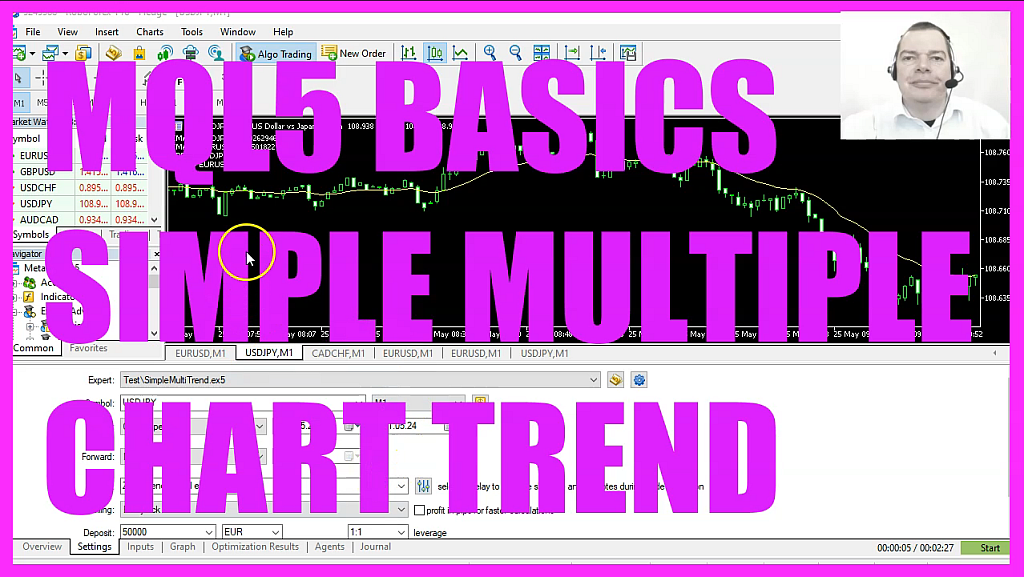
Go to the Navigator and pick the simple multi chart Trend Expert Advisor and drag it on to the chart. I will allow the modification of signal settings, but it will not actually trade. It will just show us trends and when the next tick comes in, you should see that the current trend for the Canadian dollar against the Swiss franc is a buy trend. Now please click on insert Indicators, trend, select Moving Average. Pick a period of 20 candles for the exponential moving average.
We don’t have a shift value and the EMA should be drawn for the close price. Now please click on okay, here we are and we can see we have an uptrend that is correct. Now you can right click onto the chart. Select templates and save the template. I will save it as default TPL in this case and override the current one because default TPL is what you see when you open the next chart.
Now let’s do this and open another one for Euro USD. And now you should see the exact same values for both calculations. And that is the way to check out if it really works. And in this little video you have learned how to create a simple expert advisor that is able to calculate trends for different charts and show them on the chart that you have picked, and you have coded it yourself with a few lines of MQL five code.
 Not sure what to do? Click on the automated trading assistant below
OR CLICK HERE TO BUY NOW

- MQL5 TUTORIAL BASICS - 128 SIMPLE LONG TERM TREND
- MQL5 TUTORIAL BASICS - 126 SIMPLE RUNNING TIMER
- MQL5 TUTORIAL - SIMPLE MOUSE CLICK EVENT
- MQL5 TUTORIAL BASICS - 114 SIMPLE SHIFTED PRICE EA
- MQL5 TUTORIAL BASICS 127 - SIMPLE ELLIPSE OBJECT
- MQL5 TUTORIAL BASICS - 115 SIMPLE ENVELOPESBUY TRAILING STOP
