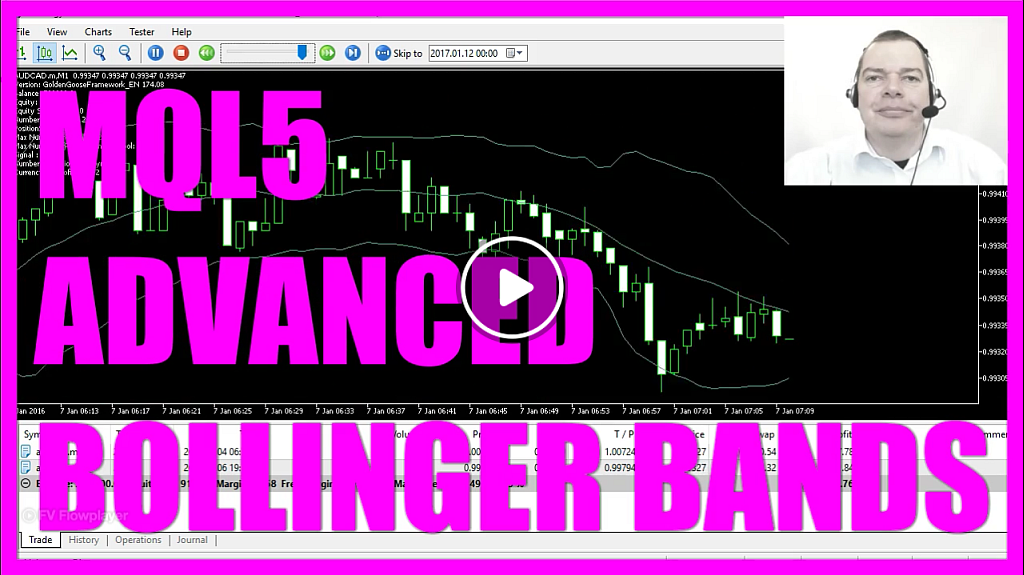
Today I would like to talk about my favourite entry, this is the Bollinger Band’s indicator and right now it is trading several different positions.
Download “MQL5 - Advanced Bollinger Bands from MQL5 Tutorial”
The Bollinger bands was the first indicator that actually made a profit for me and from that day on I was convinced that I could make it.
Now about three years later it is running in my own framework and I will speed it up a little bit and show you the results here.
And while this strategy test is running, let me explain how I do it.
I import some framework components that will do all the trade management, all the marked functions here are part of the Golden Goose framework so the only thing I have to do is to include the mq5 file for the entry.
In the OnTick function I check for an entry and afterwards I call the trade management by calling the Check For Tick function with the entry signal.
And the entry signal in our case is included in an mq5 module called Check Entry Bollinger bands.
Create an array for the prices by using mql rates and the array has the name price info and with arraysetasseries our price info array is sorted from the current candle downwards.
With copyrates we fill the array with price data for the current symbol and the current period from the current candle zero for three candles and the result will be stored in the price info array we have created here.
If you would like to have more than three candles, you could replace this line with the one above because this one will give you all the price info for the bars on the chart.
But three candles is enough for me and it’s faster to calculate.
In the next line we create a string variable for the signal that will be called Signal, and we need to create an array for several prices for the middle, the upper and the lower band of the Bollinger bands, because the Bollinger bands indicator uses three different lines.
These arrays also need to be sorted by using array set series.
Here is the Bollinger band’s definition that is created by using iBands for the current symbol and the current period.
If you insert the indicator Bollinger bands here you will see that we used twenty candles, the value for the deviation is two, and the value for the shift is zero and that’s exactly what we use here, twenty candles, no shift and deviation two, and the calculation is based on the closed price.
Now with Copy Buffer we use the Bollinger bands definition we have created here to fill the middle, the upper and the lower band with the price data we need.
We now want to calculate the Expert Advisor for the current candle, so we create a variable my middle band value zero, my upper band value zero and my lower band value zero, and assign the value of candle zero for each of our three arrays.
To calculate the Expert Advisor for the candle before, we do exactly the same for candle one.
The rest is very simple if the price info for candle one for of the close is below my lower band value one and the price info for the current candle for the close price is now above my lower band value zero, that would be an entry for a buy signal.
So the signal would be buy and in the other case it would be a sell signal.
That is when the close of the last candle was above the upper Bollinger band and the close of the current candle is below the upper Bollinger band and now we would like to sell.
And in the last step we return the signal here to the framework and that would now call the trade management with a Buy or a Sell signal.
This is the result of our Golden Goose framework trading with the Bollinger bands for the Australian against the Canadian dollar from the 1st January of 2016 to the 1st January of 2017.
Now let’s change the currency pair. I will enlarge this a little bit, and to speed up things for this little demonstration I will remove the visualization option here and start the test.
Now you can see how it works within seconds, we should be finished in a few more seconds and here is the result.
That would have been a total net profit of $8,634.
Let’s do the Euro/U.S. dollar and start the test and you see how fast this works. This also would have been a profit this time it’s only $2,453.
The reason is the Strategy Tester has to stop when the test period is over. The profit would have been much higher if we had ended our test on the last day of October and on a real account it would always be a good idea to close the account when the equity and the balance curve are almost equal so in real trading I would have closed my account exactly here.
Okay now you know how you can create an entry module for the Bollinger bands, I actually use the Golden Goose framework to trade it.
If you don’t know how to build or how to get your own framework you can get more details about it on my website and if you like results like this one you might want to create your own version of it.


