

- Introduction to Tenkan-sen Indicator in MQL5 (00:00 – 00:22)
- Introduction to creating buy and sell signals using the Tenkan-sen line from the Ichimoku Kinko Hyo indicator in MQL5. Overview of the purpose and functionality of the Tenkan-sen line.
- Setting Up in MetaEditor (00:22 – 00:44)
- Instructions on opening MetaEditor from MetaTrader and creating a new Expert Advisor file named ‘SimpleTenkansenStandaloneEA’. Initial code setup including removing unnecessary lines.
- Including Trade.mqh and Initializing CTrade (00:44 – 01:08)
- Explanation of including the ‘Trade.mqh’ file and creating an instance of the ‘CTrade’ class for opening and closing positions later in the code.
- Calculating Ask and Bid Prices (01:08 – 01:36)
- Details on calculating the Ask and Bid prices using ‘SymbolInfoDouble’ for the current symbol on the chart, and normalizing these prices with ‘NormalizeDouble’ and ‘_Digits’.
- Setting Up Price and EA Data Arrays (01:36 – 02:19)
- Creating and sorting a price array (PriceInformation) using ‘MqlRates’ and ‘ArraySetAsSeries’. Also, setting up an array for the Expert Advisor data (EAArray) and sorting it.
- Implementing Tenkan-sen Indicator (02:19 – 03:50)
- Using the ‘iIchimoku’ function to define the Expert Advisor based on the Tenkan-sen Indicator. Filling the TenkansenArray with data using ‘CopyBuffer’.
- Calculating and Assigning Signals (03:50 – 04:32)
- Determining the current Tenkan-sen value and assigning ‘sell’ or ‘buy’ signals based on its comparison with the close price of the last candle.
- Executing Trades Based on Signals (04:32 – 04:56)
- Executing sell or buy trades using ‘trade.Sell’ or ‘trade.Buy’ based on the calculated signal and the absence of open positions.
- Displaying Signal on Chart and Testing (04:56 – 05:57)
- Using the ‘Comment’ function to display the current signal on the chart. Instructions for compiling the code and testing the Expert Advisor in MetaTrader.
- Conclusion and Demonstration (05:57 – 06:19)
- Conclusion of the tutorial with a demonstration of the Expert Advisor in action, showing a buy signal and the opening of a position.
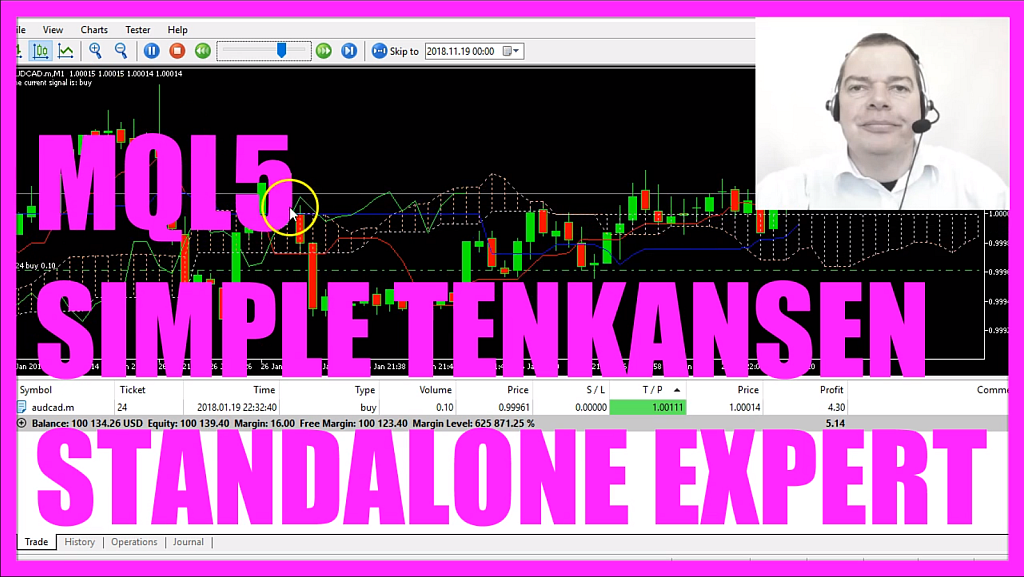
In this video we are going to create buy and sell signals and code a standalone version that is able to calculate this one line from the Ichimoku Kinko Hyo, it’s called a Tenkan-sen, that’s the red line here.
Now we want to find out how to do that in MQL5?
To do that please click on the little icon here or press F4 on your keyboard now you should see the Metaeditor window and here you want to click on: ”File/ New/ Expert Advisor (template)” from template, “ Continue”, I will call this file: “SimpleTenkansenStandaloneEA”, click on “Continue”, “Continue” and “Finish”.
Now you can delete everything above the “OnTick” function and the two comment lines here.
We start with the “include” statement to include the file “Trade.mqh”, that comes with MQL5 and we need it to create an instance of “CTrade” that will be called: “trade” and we will use it to open and close positions later on.
We start by calculating the Ask price and the Bid price, this is done by using “SymbolInfoDouble” for the current symbol on the chart, we use “SYMBOL_ASK” to calculate the Ask price and “SYMBOL_BID” to calculate the Bid price.
“NormalizeDouble” and “_Digits” will automatically calculate the right number of digits behind the dot.
Next we need to create a signal variable for the signal that also will be called: “signal” and we don’t assign a value here.
We use “MqlRates” to create a price array called: “PriceInformation”, that one will contain the prices of the candles, we use “ArraySetAsSeries” to sort the array (PriceInformation) from the current candle downwards and with “CopyRates” we fill the price array (PriceInformation) with data for the current symbol on the chart and the currently selected period on the chart. We start from the candle 0 (zero) and copy the price information for 3 candles into our price array (PriceInformation).
For the Tenkan-sen we need to create another array and we use the MQL5 function: “iIchimoku”, this one can calculate the Tenkan-sen, the Kijun-sen, the Senkou Span depending on the index buffer that we use, buffer 0 (zero) is for the Tenkan-sen, buffer 1 is for the Kijun-sen and so on.
For the parameters we use the current symbol, the currently selected period on the chart, here we have three more values; 9, 26 and 52 and when we click on: “Insert/ Indicators/ Trend/ Ichimoku Kinko Hyo” we will see the same values here so that’s how we use them. 9 is for the Tenkan-sen, 26 is for the Kijun-sen and 52 is for the Senkou Span B.
In our example we only calculate one of them; that’s the Tenkan-sen, so let’s use “ArraySetAsSeries” to sort our Tenkan-sen array (TenkansenArray) from the current candle downwards and with “CopyBuffer” we fill our Tenkan-sen array (TenkansenArray) according to the Ichimoku definition (IchimokuDefinition) that we have created here for buffer 0 (zero), we start with the current candle 0 (zero) and we use the data for 3 candles.
Now we can calculate the Tenkan-sen value (TenkansenValue) by looking at candle 0 (zero) in our “TenkansenArray”.
For our simplified example we would say that whenever the value is above, so the “ThenkansenValue” would be greater than the close price for candle 1 in our “PriceInformation” array, we would consider that to be a sell signal and so we assign the word: “sell” to or signal.
In the other case if the “TenkansenValue” is below the “PriceInformation” close price for candle 1 we would consider that to be a buy signal and now we would assign the word: “buy” to our signal.
And when the signal equals sell and we have no open positions that’s when we would use “trade.Sell” to sell 10 micro lot, otherwise if the signal equals buy and we have no open positions we would use: “trade.Buy” and buy 10 micro lot.
We finish by creating a chart output using the “Comment” function to output the text: “The current signal is:” followed by the calculated “signal”.
Now this is only one of several values that you could calculate for this Indicator, you can spend hours to learn how to read it and there are also several interpretations but in our simplified case we just go with the red line here so when you are done you can click on the “Compile” button or press F7, that should work without any errors here and if this is the case please click here or press F4 to go back to Metatrader.
When inside of Metatrader we click on; “View/ Strategy Tester” or press CTRL and R, here we select the: “SimpleTenkansenStandaloneEA.ex5”, please enable the visualization option and start your test.
…and here we are! We have a buy signal right now and whenever the price crosses the red line that would switch to a sell signal.
Now you know how to calculate the Tenkan-sen value for the Ichimoku Kinko Hyo Indicator, it’s also possible to calculate all the other values here and create specific rules but now you know how to automate the Tenkan-sen and you have coded it yourself with a few lines of MQL5 code.
Download “MQL5 Tutorial - Simple Tenkansen Standalone Expert Advisor”
SimpleTenkansenStandaloneEA.txt – Downloaded 227 times – 1.83 KB Not sure what to do? Click on the automated trading assistant below
OR CLICK HERE TO BUY NOW

- MQL5 TUTORIAL - SIMPLE ITRIX STANDALONE EXPERT ADVISOR
- MQL5 TUTORIAL - SIMPLE IVIDYA STANDALONE EXPERT ADVISOR
- MQL5 TUTORIAL - SIMPLE IDEMA STANDALONE EXPERT ADVISOR
- MQL5 TUTORIAL - SIMPLE BEARS POWER STANDALONE EXPERT ADVISOR
- MQL5 TUTORIAL - SIMPLE STANDALONE RANDOM ENTRY EA
- MQL5 TUTORIAL - SIMPLE IFRAMA STANDALONE EXPERT ADVISOR
