

- Introduction to IVIDYA Standalone Expert Advisor (00:00 – 00:26)
- Introduction to creating an Expert Advisor in MQL5 for the Variable Index Dynamic Average (IVIDYA) indicator. Explanation of buy and sell signals based on the indicator’s position relative to price candles.
- Setting Up in MetaEditor (00:26 – 01:01)
- Instructions on opening MetaEditor from MetaTrader and creating a new Expert Advisor file named ‘SimpleIVIDYAStandaloneEA’. Initial code setup including removing unnecessary lines.
- Including Trade.mqh and Initializing CTrade (01:01 – 01:30)
- Explanation of including the ‘Trade.mqh’ file and creating an instance of the ‘CTrade’ class for opening positions later in the code.
- Calculating Ask and Bid Prices (01:30 – 01:49)
- Details on calculating the Ask and Bid prices using ‘SymbolInfoDouble’ and normalizing these prices with ‘NormalizeDouble’ and ‘_Digits’.
- Setting Up Price and EA Data Arrays (01:49 – 02:47)
- Creating and sorting a price array (PriceArray) using ‘MqlRates’ and ‘ArraySetAsSeries’. Also, setting up an array for the Expert Advisor data (EAArray) and sorting it.
- Implementing IVIDYA Indicator (02:47 – 04:10)
- Using the ‘iVIDyA’ function to define the Expert Advisor based on the Variable Index Dynamic Average Indicator. Filling the EAArray with data using ‘CopyBuffer’.
- Calculating and Assigning Signals (04:10 – 05:02)
- Determining the current IVIDYA value and assigning ‘sell’ or ‘buy’ signals based on its comparison with the close price of the last candle.
- Executing Trades Based on Signals (05:02 – 05:29)
- Executing sell or buy trades using ‘trade.Sell’ or ‘trade.Buy’ based on the calculated signal and the absence of open positions.
- Displaying Signal on Chart and Testing (05:29 – 06:01)
- Using the ‘Comment’ function to display the current signal on the chart. Instructions for compiling the code and testing the Expert Advisor in MetaTrader.
- Conclusion and Demonstration (06:01 – 06:41)
- Conclusion of the tutorial with a demonstration of the Expert Advisor in action, showing a buy signal and the opening of a position.
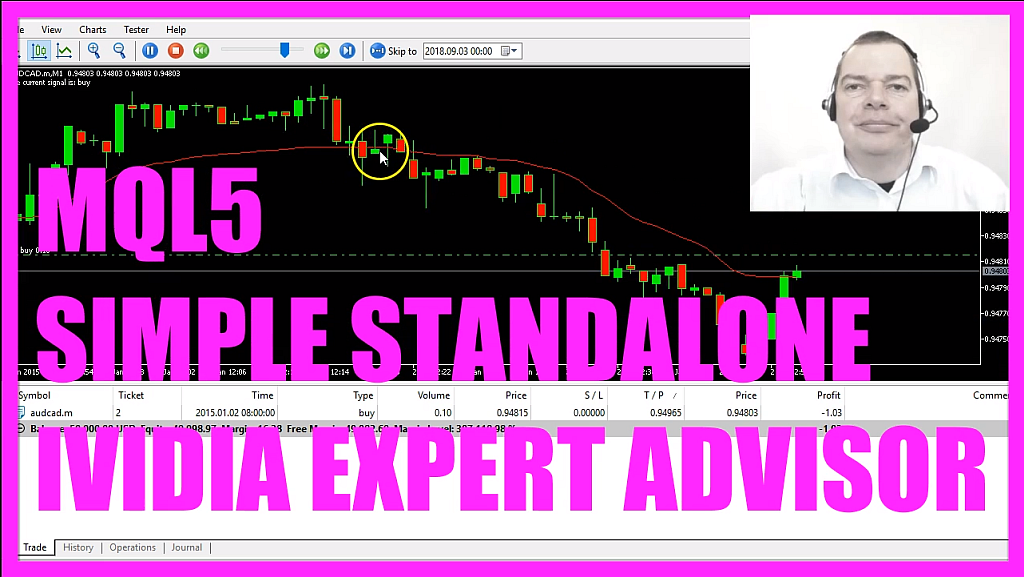
In this video we are going to create an Expert Advisor to calculate this Indicator; it’s the Variable Index Dynamic Average, whenever the red line is above the price that would be a sell signal and in the other case when the red line is below the candles – like here – that would be a buy signal.
Now how can we create an Expert Advisor that is going to actually trade our signal and output our buy and sell signals directly on the chart?
To do that please click on the little button here or press F4 on your keyboard and now you should see the Metaeditor window and here you want to click on: “File/ New/ Expert Advisor (template)” from template, I will call this file: “SimpleIVIDYAStandaloneEA”, click on “Continue”, “Continue” and “Finish”.
Now we can remove everything that is above the “OnTick” function and let’s also delete the two comment lines here.
We start by including the file: “Trade.mqh”. Sometimes people ask me where the file is?
Well, it’s included in MQL5 and we can create an instance of the class: “CTrade” that will be called: “trade” and we are going to use it later on to open positions.
Inside of the “OnTick” function we are going to calculate the Ask price and the Bid price. We get the prices by using “SymbolInfoDouble”, we use “SYMBOL_ASK” to calculate the Ask price and “SYMBOL_BID” to calculate the Bid price.
With “NormalizeDouble” and “_Digits” we calculate the number of digits behind the dot.
Let’s create a string variable that will be called: “signal” and we are going to calculate the signal value later on so we don’t assign a value right now.
We also need to create a price array (PriceArray) that is done by using “MqlRates”, lets sort the array from the current candle downwards by using “ArraySetAsSeries” and with “CopyRates” we fill our array (PriceArray) with price data for the current symbol on the chart and the currently selected period, we are going to start from the current candle 0 (zero) and we need the price for 3 candles – that’s for the prices.
Now we need to create an array for the Expert Advisor data that will be called: “EAArray”, let’s also sort that one by using “ArraySetAsSeries”.
Now we actually can define the Expert Advisor by using the integrated “iVIDyA” function. If you mark that one and hit F1 you will see all the parameters for the Variable Index Dynamic Average Indicator, it has only one buffer and the parameters are: the current symbol on the chart, the currently selected period on the chart, here we have a 9, a 12 and a 0 (zero) – so let’s click on: “Insert/ Indicators/ Trend/ Variable Index Dynamic Average” and you will see that we have a “Period CMO:” that is 9, the “Period EMA:” that is 12 and the “Shift:” value of 0 (zero) and that’s exactly what we use here and the value will be calculated based on the close price (PRICE_CLOSE). So let’s use “CopyBuffer” to fill our array (EAArray) with data according to the IVIDYA definition (iVIDyADefinition) we have created here, it’s for only one buffer – the first buffer is buffer 0 (zero) – the current candle is also candle 0 (zero), we need data for 3 candles so we use a 3 here and save it in our “EAArray”.
So far so good; to get the current value we just look into our “EAArray” and we need the value for the current candle – that’s candle 0 (zero) – now we can actually calculate the signal. Whenever the current iVIDyA value (iVIDyAVALUE) is bigger than the close price of the last candle in our price array (PriceArray) that would be a sell signal and that’s when we want to assign the word: “sell” to our signal.
In the other case if the iVIDyA value (iVIDyAVALUE) is smaller than the price array 1 close price for candle 1 (PriceArray[1].close) that would be a buy signal and now we assign the word: ”buy” to our signal.
Whenever our signal equals sell and “PositionsTotal” is less than 1 – with other words we don’t have any open position – we use “trade.Sell” to sell 10 micro lot. In the other case if the signal equals buy and we have no open positions we would use “trade.Buy” to buy 10 micro lot.
In the last step we also create a chart output by using the “Comment” function, it would output the words: “The current signal is:” followed by the signal that we have calculated.
Please don’t forget the closing bracket here and when you are done you can click on the “Compile” button here or press F7. That worked without any errors here so now we can click here or press F4 to go back to Metatrader.
In Metatrader we click on: “View/ Strategy Tester” or press CTRL and R, here we select our new file: “SimpleIVIDYAStandaloneEA.ex5”, let’s enlarge this here, mark the visualization option and start a test.
…and here is our first trade, our Expert Advisor is working, the signal line is below the candles here so we have a buy signal, it actually opened our first position and now you know how to create a standalone version for the Variable Index Dynamic Average Indicator that actually is going to trade automated and you have created it yourself with a few lines of MQL5 code.
Download “MQL5 TUTORIAL - SIMPLE IVIDYA STANDALONE EXPERT ADVISOR”
SimpleIVIDYAStandaloneEA.txt – Downloaded 329 times – 1.69 KB Not sure what to do? Click on the automated trading assistant below
OR CLICK HERE TO BUY NOW

- MQL5 TUTORIAL - SIMPLE ITRIX STANDALONE EXPERT ADVISOR
- MQL5 TUTORIAL - SIMPLE TENKANSEN STANDALONE EXPERT ADVISOR
- MQL5 TUTORIAL - SIMPLE BEARS POWER STANDALONE EXPERT ADVISOR
- MQL5 TUTORIAL - SIMPLE IDEMA STANDALONE EXPERT ADVISOR
- MQL5 TUTORIAL - SIMPLE STANDALONE RANDOM ENTRY EA
- MQL5 TUTORIAL - SIMPLE IFRAMA STANDALONE EXPERT ADVISOR
