

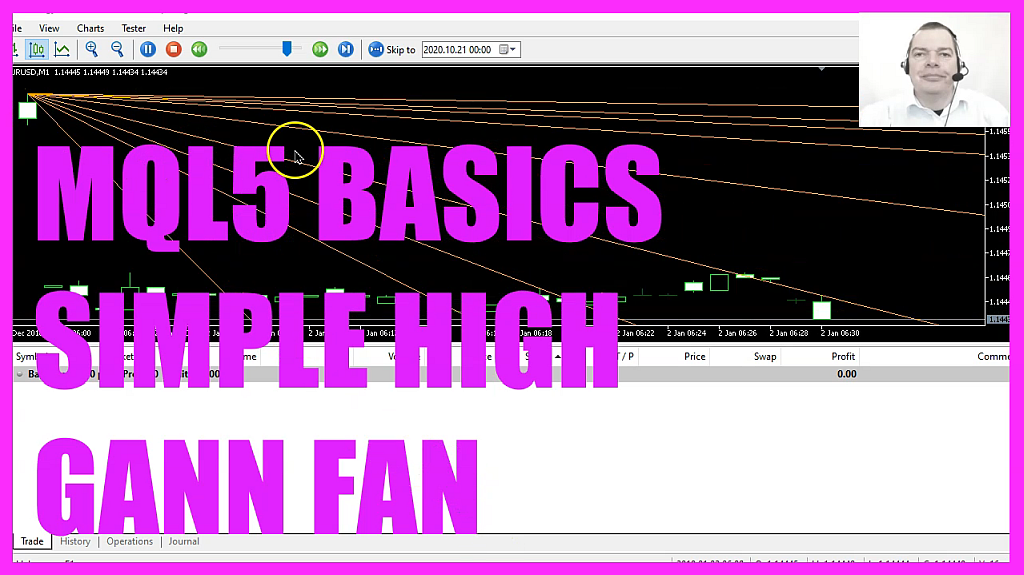
In this video we are going to create such an object here, the so-called Gann Fan, and we want to find out how to do that with MQL5. To get started, please click on the little icon here, or press F4 on your keyboard. Now you should see the MetaEditor window, and here you want to click on file, new file, expert advisor from template, continue. I will call this file SimpleHighGannFan, click on continue, continue, and finish.
Now you can delete everything above the OnTick function and let’s remove the two comment lines here. We are going to calculate the number of candles on the chart, and that can be done by using ChartGetInteger. The first parameter is for the chart ID zero, the second one is called chart first visible bar, and if you mark that and press F1 you will see that it returns the number of the first visible bar on the chart, the last parameters for the sub window. The one with the candles is windows zero.
Now let’s create a variable for the highest candle, and I would also like to create an array for the highest prices, it is called High and it will contain all the highest prices for each candle on the chart. First, we need to use ArraySetAsSeries to sort the high array from the current candle downwards. And now we can use a function called CopyHigh, this one will give us the highest bar prices for the current symbol on the chart and the currently selected period on that chart.
We want to start with the current candle zero for all the candles on the chart and copy the values into our high array. And now we can get the highest candle by using this function ArrayMaximum that will give us the largest element in our array. The array is called High, we want to start to search for the highest candle with candle zero and go through all the candles on the chart, and the result is the number of the highest candle.
We also need to use MQLRates for another array called price information, because MQLRates also stores the time, and for each object we need to know the time and the value to draw it. Let’s also sort this one with ArraSetAsSeries from the current candle downwards, and now we can fill the array with data by using CopyRates for the current symbol on the chart and the currently selected period on that chart, starting from the current candle zero for all the candles on the chart we want to store the price information in our array.
Before we can create a new object we want to use ObjectDelete for the current symbol on the chart and the object that is called SimpleHighGannFan, we use ObjectDelete to remove old objects before we draw a new one. This will not be the case, the very first time we call this function, but afterwards we always have an old object that needs to be removed and to draw an object we use ObjectCreate.
The first parameter, zero, is for the chart ID, the second parameter is the object name. In my case it’s SimpleHighGannFan. Basically you can use any name you want, but you need to use the exact same name everywhere. Parameter three is the object type, we have used OBJ_GannFan, and if you mark that and press F1 you will see that there are different object types. We use this one, it will draw these lines on our candle chart, we want to draw it inside of the main chart with the candles, so that’s the window zero.
My starting point is the time when the highest candle inside of our price information array was drawn, and I would like to have it for the highest price of the highest candle. The second point in time will be the current time when the current candle zero is drawn, and the value will be the highest price of the current candle, and that’s it for the ObjectCreate part. Of course, you can use other values here, but for this simple example it’s good enough.
Now let’s change a few properties that can be done by using ObjectsetInteger for chart ID zero, I would like to change a property for the object that is called SimpleHighGannFan, the property I want to change is object property color, and I would like to change it to orange. Another property is called object property direction. The first part is the same, but this time we want to change this property and I have used Gann Down Trend here, that stands for a line corresponding to the downward trend.
Let’s modify another property, this one is called object property scale, and I have used the value of two. And finally, the last one, this is called object property ray right. I have set it to true, and it will be used to draw the line to the current candle and into the future. So far so good, if this was too fast for you, or if you have no idea what all the code here does, maybe you want to watch one of the other videos in this basic video series, or maybe even the premium course on our website might be interesting for you.
For now, I want to click on view, toolbar, and click on the compile button, or press F7. This should work without any errors, and if that is the case you can click on the little button here, or press F4 to go back to MetaTrader.
In MetaTrader, we want to click on view, strategy tester, please pick the new file, SimpleHighGannFan.ex5, mark the option for the visual mode here and start a test. Here we are, our object is drawn on the chart, we can zoom in or out, and the lines will be adjusted. So our little expert advisor works as designed, and in this little video you have learned how to create a Gann Fan object right on your chart and you have coded it yourself with a few lines of MQL5 code.
 Not sure what to do? Click on the automated trading assistant below
OR CLICK HERE TO BUY NOW

- MQL5 TUTORIAL BASICS 127 - SIMPLE ELLIPSE OBJECT
- MQL5 TUTORIAL - SIMPLE MOUSE CLICK EVENT
- MQL5 TUTORIAL BASICS - 126 SIMPLE RUNNING TIMER
- MQL5 TUTORIAL - COPILOT AI PROGRAMMING (WITH SOME ISSUES)
- MQL5 TUTORIAL BASICS - 114 SIMPLE SHIFTED PRICE EA
- MQL5 TUTORIAL BASICS - 117 SIMPLE MULTIPLE CHART TREND
