

In this video we are going to create a line object that is drawn from the lowest low of the lowest candle on the chart to the current low, so let’s find out how to do that with mql5.
To get started please click on a little icon here or press F4 on your keyboard, now you should see the Metaeditor window and here you want to click on file, new file, expert advisor from template, continue, I will call this file, simple low price line, click on continue, continue and finish.
Now you can delete everything above the ontick function and the two comment lines here.
First, we want to get the numbers of candles on the chart and that can be done by using chart get integer. We want to do that for the current chart id zero and we want to get chart underscore first underscore visible underscore bar. The last parameter is for the sub-window, zero is the sub-window with the candles and now that we have the number of candles on the chart let’s find out what is the lowest candle so we create a variable called lowest candle and we also need to create an array called low that will hold the lowest candle prices for all the candles.
Now let’s use array set as series for the array to sort the current array from the current candle downwards. To fill the array with data we can use copy low that will give us the minimal bar prices for the current symbol on the chart and the currently selected period on that chart, starting from the current candle zero for all the candles on the chart and it will store the values in the low array.
And now we can calculate the number for the lowest candle by using array minimum that will search for the lowest element in the array, in this case, it will search in our array low starting from candle zero for all the candles on the chart and give us the lowest candle number.
We continue by using mql rates to get the price information on the chart.
Once again we use array set as series to sort this array from the current candle downwards and now we use copy rates for the current symbol on the chart and the currently selected period on that chart to copy the price information for all the candles from the current candle zero and for all the candles on the chart into our price information array, so now we have the price data and we have the number of the lowest candle.
And in the next step, we use object delete for the current symbol on the chart and we want to delete all the objects that have this name, simple low line trend that will not exist the first time we run the code but afterwards we want to remove the old values each time and draw a new line.
And that is done by using object create for the current symbol on the chart, the second parameter is the name of the object, we have called it simple low line trend.
Parameter three is for the type of the object, we use obj underscore trend, there are lots of other object types that we could choose but for this object type, we need to tell Metatrader to draw it in the main window that is window zero.
This is the time for the lowest candle on the chart because this is the time line.
The next parameter is for the price level of the lowest candle because this is the price value line and here is the starting point.
And the next two parameters will tell Metatrader to draw the line for the current candle zero and especially for the lowest price of that candle, so now we have two points that define how the line will be drawn but we want to add a few changes to the line properties that can be done by using object set integer for the chart id zero and the object that is called simple low line trend, we want to change the object property color, in my case, I would like to have a red color.
Now let’s repeat that this time for object property style, I’m using a solid style here, we could also decide to use a dotted line, in this case, you would use style underscore dot, here comes another one, this time we are going to change the object property width, I use a value for a thin line.
And the last parameter that we are going to change is called obj property ray right and that is used if you want to draw the line into the future, so that’s about it.
If this was too fast for you or if you have no idea what all the code here does maybe you want to watch one of the other videos in the basic video series or maybe even the premium course on our website might be interesting for you, for now, we want to click on view, toolbar and click on the compile button or press F7.
I made a mistake, it says I missed a semicolon here, now let’s recompile the code and this time it works.
This is a good example because when you see a dozen errors below that doesn’t really mean that you made a dozen mistakes, just by removing the one semicolon I can produce fourteen errors here, so please keep that in mind, from just one little thing.
Now let’s compile it again and press the little button here or press F4 to go back to Metatrader.
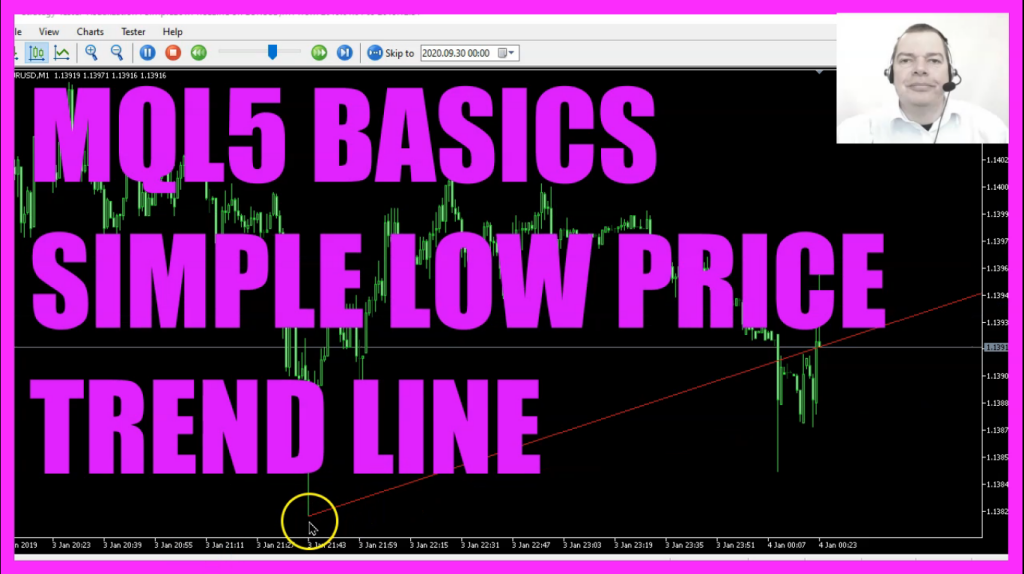
And in Metatrader we want to click on view, strategy tester or press control and r, now let’s pick the new file, simple low price line dot ex5, mark the option for the visual mode here and start a test.
Here is our expert advisor, its drawing lines. Now let’s zoom in, speed it up and you see it works as expected and in this little video, you have learned how to create a line object that is drawn from the lowest candle on the chart to the current low price and you have coded it yourself with a few lines of mql5 code.
 Not sure what to do? Click on the automated trading assistant below
OR CLICK HERE TO BUY NOW

- MQL5 TUTORIAL BASICS 127 - SIMPLE ELLIPSE OBJECT
- MQL5 Tutorial - Advanced Trading Range Calculation
- MQL5 TUTORIAL BASICS - 114 SIMPLE SHIFTED PRICE EA
- MQL5 TUTORIAL BASICS - 117 SIMPLE MULTIPLE CHART TREND
- MQL5 TUTORIAL - SIMPLE ICCI EXPERT ADVISOR
- MQL5 Tutorial - Simple Force Index Trading Robot
