

In this video, we are going to use shifted exponential moving averages that are drawn into the future to find out if we have a buy or sell signal, so let’s find out how to do that with mql5.
To get started please click on the little icon here or press F4 on your keyboard, now you should see the Metaeditor window and here you want to click on file, new file, expert advisor from template, continue, I will call this file simple shifted ema, click on continue, continue and finish.
Now you can delete everything above the ontick function and the two comment lines here, we start with an include statement to include the file trade dot mqh.
Afterwards, we create an instance of the class ctrade that will be called trade and we are going to use it to open and close positions.
Let’s create three user-defined input variables, one for the number of candles that we are going to use to calculate the moving averages and two shift values, those shift values here are used to draw the exponential moving average on the right side of the current price, it looks as if they can predict the future but actually they are just moved to the right side.
Inside of the ontick function we want to calculate the ask price and the bid price by using symbol info double for the current symbol on the chart, we use symbol underscore ask or symbol underscore bid and with normalize double and underscore digits we make sure that we calculate the right number of digits behind the dot.
Afterwards, we create a string variable called signal for our signal, please don’t assign a value here because we are going to calculate that now.
Let’s create two arrays, one for the first moving average and another one for the second moving average, afterwards, we are going to use array set as series for both moving averages to sort them from the current candle downwards.
Let’s define the properties that is done by using the ima function for the current symbol on the chart and the currently selected period on that chart.
We are going to calculate the number of candles that we have defined here, in our case twenty candles, the result for the moving average will be shifted by twenty candles, we use mode underscore ema for an exponential moving average that is calculated based on the close price and here we repeat the same thing for the second moving average, that’s the exact same number of candles but this time we are going to use another shift value, in our case one hundred candles.
And now we are going to fill the array with data according to the moving average definition that we have created here, we do that for the first buffer starting with candle zero for three candles and store the result in the moving average array.
Let’s repeat that for the second moving average except for those two variable names everything is the same and now we want to check if the price is above both moving averages, so if the ask price is bigger than the value for candle zero in the first moving average array and if the ask price is also above the value for candle zero in the second moving average array that’s when we have a buy signal so we assign the word buy to our signal.
If the bid price is below candle zero for the first moving average array and if the bid price is also below candle zero for the second moving average array that’s when we have a sell signal and now we assign sell to our signal and when our signal equals sell and positions total delivers a value that is below one that would mean we have a sell signal and no open positions and in that case, we use trade dot sell to sell ten micro lot.
In the other case if the signal equals buy and we have no open positions we use trade dot buy to buy ten micro lot.
Finally, we want to create a chart output that is done by using the comment statement, this will output the text, the signal is now followed by the calculated signal.
Okay! That’s about it! If you don’t understand what all the code here does or if this was too fast for you maybe you want to watch one of the other videos in this basic video series first or maybe even the premium course on our website might be interesting for you, for now, please click on the compile button or press F7, I didn’t get any errors here and if this is the case we can click on a little button here or press F4 to go back to Metatrader.
And in Metatrader we need to use a little trick, please open a clean chart, click on insert, indicators, trend, moving average, I would like to see an exponential moving average for twenty candles, one has the shift value of one hundred and the result is calculated based on the close price, so let’s click on okay.
Now we repeat the process, let’s add another one, this time with a shift value of twenty and red color, everything else is the same. let’s zoom into the chart to make the moving averages visible, now right-click, select templates, save template and save this one as tester dot tpl because this is going to be used in the strategy tester, you can override the current one but please make sure that you have selected the right values that also match the values here for the inputs.
If you don’t see the strategy tester please click on view, strategy tester or press control and r, please pick the new files, simple shifted ema dot ex5, mark the option for the visual mode here and start a test.
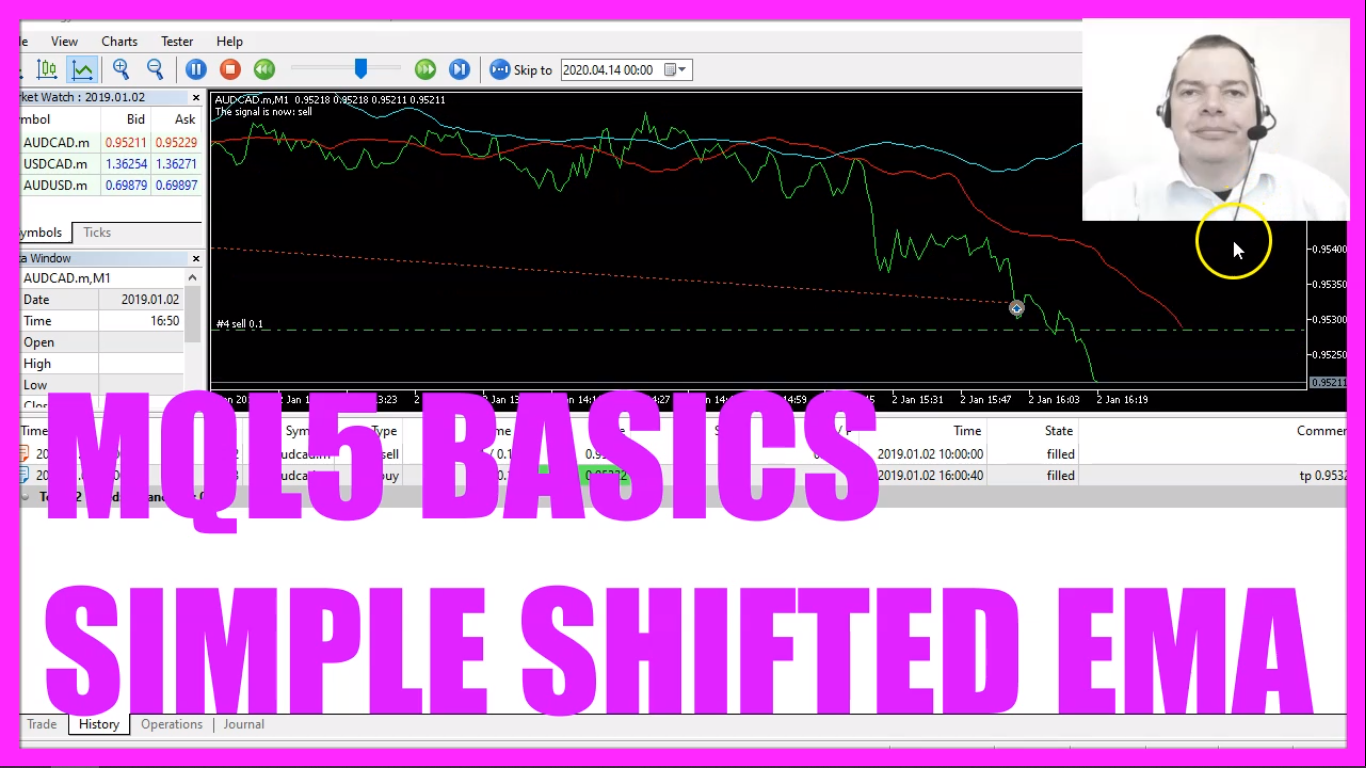
Here we are! The expert advisor is working, the price is below both moving averages so this is a sell signal and we have a first open position here, let’s speed that up a little bit and once the price is above both other moving averages we should get a buy signal.
And now we have a buy signal because the price is above both other moving averages, so our little expert advisor is working as expected and in this little video you have learned how to use two exponential moving averages to create buy and sell signals and you have coded it yourself with a few lines of mql5 code.
 Not sure what to do? Click on the automated trading assistant below
OR CLICK HERE TO BUY NOW

- MQL5 TUTORIAL - SIMPLE SHIFTED SMA EXPERT ADVISOR
- MQL5 TUTORIAL BASICS - 114 SIMPLE SHIFTED PRICE EA
- MQL5 TUTORIAL - HOW TO CREATE A SHIFTED MOVING AVERAGE
- MQL5 TUTORIAL BASICS - 117 SIMPLE MULTIPLE CHART TREND
- MQL5 TUTORIAL - SIMPLE SIGNAL STACKING
- MQL5 TUTORIAL BASICS - 128 SIMPLE LONG TERM TREND
