

- Introduction to Drawing Chart Objects in MQL5 (00:00 – 00:16)
- Introduction to the tutorial on creating an Expert Advisor in MQL5 that can draw objects, like rectangles, on the chart.
- Starting with MetaEditor and Creating a New File (00:16 – 00:41)
- Instructions on opening MetaEditor and creating a new Expert Advisor file named “Simple Chart Object”.
- Setting Up the Code Structure (00:41 – 00:49)
- Steps to clean up the code by removing unnecessary parts above the OnTick function.
- Creating Variables and Arrays for Candle Data (00:49 – 01:02)
- Creating variables for the highest and lowest candles and declaring arrays to store their data.
- Sorting Arrays and Copying High and Low Values (01:02 – 01:36)
- Using ‘ArraySetAsSeries’ to sort arrays and ‘CopyHigh’ and ‘CopyLow’ functions to fill them with candle values.
- Finding the Highest and Lowest Candle Values (01:36 – 02:12)
- Using ‘ArrayMaximum’ and ‘ArrayMinimum’ functions to find the highest and lowest values in the arrays.
- Setting Up Price Information Structure (02:12 – 03:27)
- Using the ‘MqlRates’ structure to store price, volume, and spread information, and filling the array with ‘CopyRates’.
- Deleting and Creating Chart Objects (03:27 – 04:10)
- Using ‘ObjectDelete’ to remove previous rectangles and ‘ObjectCreate’ to draw a new rectangle on the chart.
- Configuring the Rectangle Object (04:10 – 05:02)
- Setting up the rectangle object’s position, size, and appearance, including color and fill.
- Compiling and Testing the Expert Advisor (05:02 – 06:13)
- Instructions on compiling the Expert Advisor and testing it in MetaTrader using the Strategy Tester.
- Demonstration and Conclusion (06:13 – 06:23)
- Demonstrating the drawn object on the chart and concluding the tutorial.
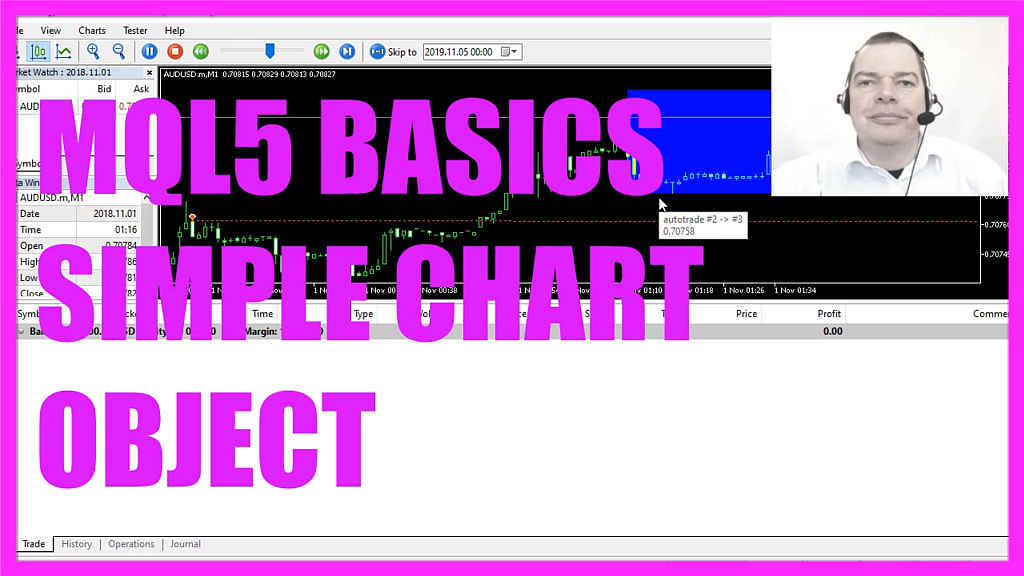
In this video we are going to create an expert advisor that is able to draw an object on the chart like in this case a rectangle, so let’s find out how to do that with mql5.
To get started please click on the little icon here or press F4 on your keyboard, now you should see the Metaeditor window and here you want to click on file, new file, expert advisor from template, continue, I will call this file simple chart object, click on continue, continue and finish.
Now you can delete everything above the on tick function and we also remove the two comment lines here.
We start by creating two variables for the highest candle and the lowest candle, we also need two arrays, the first one is called high, the second one low.
We use array set as series to sort the arrays from the current candle downwards and afterwards we use copy high for the current symbol on the chart and the currently selected period to fill the array called high from candle zero up to candle thirty with the high values, that’s why we use copy high and to get the lowest values we use copy low.
You could also use something like copy open or copy close if you would like to get the open and close prices.
To get the highest candle we use array maximum. This is also a function that is included in mql5 and it looks into our high array and finds the highest value from candle zero to candle thirty.
So let’s repeat that for the lowest candle, this time we use array minimum to look inside the array called low and find the lowest value from candle zero to candle thirty.
We also need to have some price information, so we use mql rates, that is a structure that stores information about prices, volumes and spreads.
We call the array price information and once again we use array set as series to sort it from the current candle downwards and now we use copy rates to fill our array for the current symbol on the chart and the currently selected period. By the way, this is the old way to do that, it is equal to this notation, so let’s actually exchange that.
We will start at the current candle zero and this expression here is able to get all the candles on the chart but it consumes a lot of calculation power so if your system is a little weak you could exchange that with a number of candles that is fixed and now we have some price information that is saved in our price array.
The next step is to use object delete to delete the former rectangles for the current symbol on the chart, the object name is rectangle, it will not delete anything when you run the expert advisor for the very first time.
And afterwards, we use object create for the current symbol on the chart to create an object called rectangle, therefore we use the object type obj underscore rectangle and if you mark that and press F1 you will see that there are a lot of other object types. You could, for example, use a button or a label, each of these object types has different settings and values, in our case, the next parameter is zero that is the main window because the rectangle is drawn here where the candles are.
For oscillators, you would see a separate window below.
The object should be drawn from candle thirty to candle zero and we want the upper border to be on the highest high of the highest candle. The lower border will be on the lowest low of the lowest candle within these thirty candles.
Now we use object set integer on the main window. To set the color for the object with the name rectangle we use object property color for this and set the color to blue and to fill the rectangle object we use object property fill to also use blue to fill the rectangle and that’s about it.
Now if this was a too fast for you or if you don’t know what all the code here does, you maybe want to watch one of the other videos in this basic video series first or maybe even the premium course might be interesting for you. You can find that one on our website.
But for now, please click on the compile button or press F7, this worked without any errors and if this is the case you can click on this little symbol here or press F4 to go back to Metatrader.
And in Metatrader we click on view, strategy tester or press control and r, please pick the new file simple chart object dot ex5, mark the visual mode here and start a test.
And here we are! Our object is drawn and in this little video, you have learned how to automatically draw objects on your chart and you have coded it yourself with a few lines of mql5 code.
 Not sure what to do? Click on the automated trading assistant below
OR CLICK HERE TO BUY NOW

- MQL5 Tutorial - Simple Chart Objects
- How to create a line object in MQL5
- How to create a chart object with MQL5
- MQL5 TUTORIAL BASICS 127 - SIMPLE ELLIPSE OBJECT
- How to create a label object with MQL5
- MQL5 Tutorial - Calculating Time Difference in…
