

MQL5 Tutorial – Simple ITRIX Standalone Expert Advisor (00:00 – 00:02)
- Introduction to creating a standalone Expert Advisor for the Triple Exponential Average (ITRIX) indicator in MQL5.
Overview of ITRIX Indicator (00:02 – 00:15)
- Explanation of the ITRIX indicator, where the red line below the dotted line indicates a sell signal, and above it indicates a buy signal.
Creating an Expert Advisor in MetaEditor (00:15 – 00:46)
- Instructions on opening MetaEditor in MetaTrader and creating a new Expert Advisor file named ‘SimpleItrixStandaloneExpertAdvisor’.
Initial Code Setup (00:46 – 01:06)
- Removing unnecessary lines and preparing the initial code setup in the MetaEditor.
Including Trade.mqh and Initializing CTrade (01:06 – 01:20)
- Including the ‘Trade.mqh’ file and creating an instance of the ‘CTrade’ class for later use in opening trades.
Calculating Ask and Bid Prices (01:20 – 01:45)
- Using ‘SymbolInfoDouble’ to calculate Ask and Bid prices and normalizing these prices with ‘NormalizeDouble’ and ‘_Digits’.
Setting Up Price Array (01:45 – 02:08)
- Creating a price information array and using ‘ArraySetAsSeries’ to sort the array from the current candle downwards.
Filling Price Array with Data (02:08 – 02:21)
- Using ‘CopyRates’ to fill the price array with data for the current symbol and selected period on the chart.
Creating Signal and Price Data Arrays (02:21 – 02:49)
- Creating a string variable for the signal and another array to hold price data for the indicator.
Implementing ITRIX Indicator (02:49 – 03:19)
- Using the built-in ‘iTriX’ function to define the Expert Advisor based on the ITRIX indicator.
Filling Price Array with Indicator Data (03:19 – 03:30)
- Using ‘CopyBuffer’ to fill the price array with data according to the ITRIX definition.
Calculating ITRIX Value and Assigning Signals (03:30 – 04:17)
- Getting the value for the current candle and assigning ‘buy’ or ‘sell’ signals based on the ITRIX value.
Executing Trades Based on Signals (04:17 – 04:46)
- Using ‘trade.Sell’ or ‘trade.Buy’ to execute trades based on the calculated signal and the absence of open positions.
Displaying Signal on Chart (04:46 – 05:07)
- Using the ‘Comment’ function to display the current signal on the chart.
Testing the Expert Advisor (05:07 – 05:30)
- Instructions for compiling the code and testing the Expert Advisor in MetaTrader using the Strategy Tester.
Conclusion (05:30 – 05:38)
- Conclusion of the tutorial with a demonstration of the Expert Advisor in action, showing how it trades the Triple Exponential Average and outputs buy and sell signals on the chart.
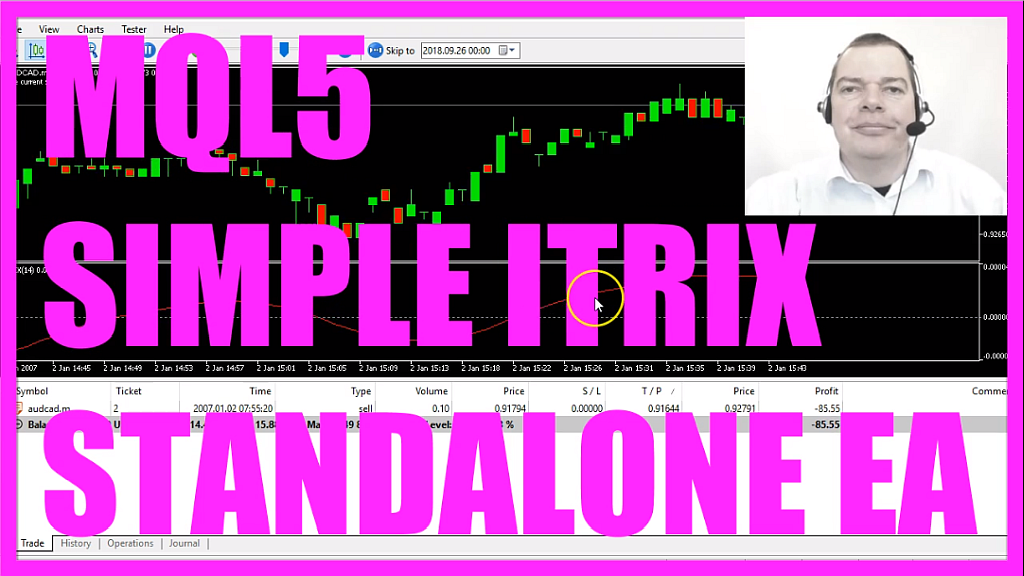
In this video we are going to create a Standalone version for an Expert Advisor that is able to handle this Indicator here: it is the Triple Exponential Average, whenever the red line is below the dotted line that’s a sell signal and when it crosses the line and is above the dotted line that is a buy signal.
Download “MQL5 TUTORIAL - SIMPLE ITRIX STANDALONE EXPERT ADVISOR”
Now how can we create an Expert Advisor that is able to automatically open trades for the signal here?
To do that please click on the little button here or press F4 in your Metatrader, now you should see the Metaeditor window and here you want to click on: “File/ New/ Expert Advisor (template)” from template, “Continue”, I will call this one: “SimpleItrixStandaloneExpertAdvisor” , click on “Continue”, “Continue” and “Finish”.
Now we can delete everything above the “OnTick” function and let’s also remove the two comment lines here.
We start by including the “Trade.mqh” file that one comes with MQL5 and it helps us to create an instance of the class “CTrade” that will be called: “trade” and we are going to open trades with it later on.
Inside the “OnTick” function we start by calculating the Ask and the Bid price, we get that by using “SymbolInfoDouble” for the current symbol and with “SYMBOL_ASK” we will get the Ask price and “SYMBOL_BID” will deliver us the Bid price.
We also use “NormalizeDouble” and “_Digits” to calculate the right number of digits behind the dot for each currency pair. With “MqlRates” we create a price info (PriceInfo) array that will hold our price data, first we use “ArraySetAsSeries” for the price info array (PriceInfo) to sort the price array from the current candle downwards and afterwards we use “CopyRates” for the current symbol and the currently selected period on the chart to fill the price array (PriceInfo) with price data. We start at candle 0 (zero) – that’s the current candle – we copy the price info for 3 candles and store the values in the price info array (PriceInfo).
Let’s create a string variable for the signal that will also get the name “signal” but we don’t assign a value here because that needs to be calculated later on, first we need to create another array. This one will hold the price data for the Indicator (myPriceArray), MQL5 comes with the built-in “iTriX” function that will help us to create the definition for our Expert Advisor here. We are also using the current symbol, the currently selected period on the chart, 14 is the number of candles, you will also see it in the brackets here and the calculation will be done for the close prices.
Once again we use “ArraySetAsSeries” to sort the price array (myPriceArray) from the current candle downwards and now we use “CopyBuffer” according to the itrix definition (iTriXDefinition) that we have created here to fill our price array (myPriceArray) with data for the buffer 0 (zero) – that’s the red line here – and we do that from the current candle 0 (zero) for 3 candles.
Now we can get the value for the current candle by looking into candle 0 (zero) of our price array (myPriceArray) and assign the value to the variable itrix value (iTriXValue) and if that “iTriXValue” is above 0 that would be a buy signal so we assign the word: “buy” to our signal.
Otherwise if the “iTriXValue” is below 0 that would be a sell signal and in that case we assign the word: “sell” to our signal.
If the signal equals sell and “PositionsTotal” is below 1 – in other words we don’t have any open positions – that’s when we want to use “trade.Sell” to sell 10 micro lot. In the other case if the signal equals buy and we have no open positions we use “trade.Buy” to buy 10 micro lot.
Finally we use the “Comment” function to output the sentence: “The current signal is:” followed by the calculated “signal” directly on our chart.
Okay, that’s it, please click on: “Compile” or press F7, that worked without any errors here so now I can click on the little button here or press F4 to go back to Metatrader and in Metatrader we click on: “View/ Strategy Tester” or press CTRL and R, here we pick the file: “SimpleItrixStandaloneExpertAdvisor”, mark the visualization option and start a test.
…and here we are! We already have opened a trade here and now you know how to create a standalone version that is able to trade the Triple Exponential Average, output the buy and sell signals directly on the chart and you have coded it yourself with a few lines of MQL5 code.
 Not sure what to do? Click on the automated trading assistant below
- Harness the Power of an MQL5 Signal for Automated Trading
- MQL5 TUTORIAL - SIMPLE IDEMA STANDALONE EXPERT ADVISOR
- MQL5 TUTORIAL - SIMPLE IVIDYA STANDALONE EXPERT ADVISOR
- MQL5 TUTORIAL - SIMPLE TENKANSEN STANDALONE EXPERT ADVISOR
- MQL5 TUTORIAL - SIMPLE IFRAMA STANDALONE EXPERT ADVISOR
- MQL5 TUTORIAL - SIMPLE ITEMA EXPERT ADVISOR
