

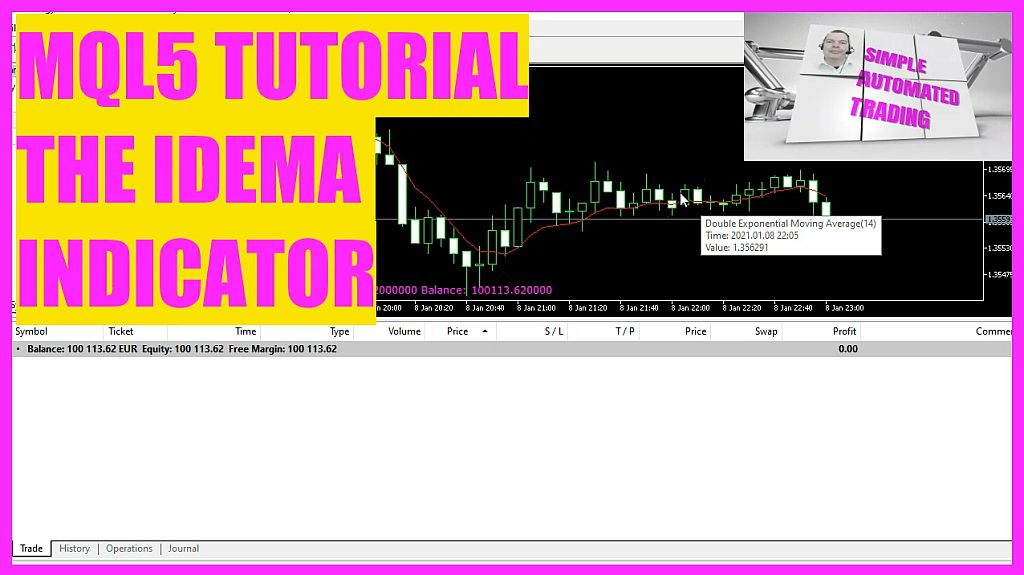
In this video we are going to calculate this little red line here. It is called the double exponential moving average, and we will now create an entry module to calculate buy and sell signals.
This time, we’re going to figure out the IDEMA indicator and use it to calculate a trading system entry signal.
The IDEMA indicator is painted right on the candle chart, and it shows up as a red line. If you point your mouse cursor over it, you will see that it creates a double exponential moving average.
To start, we make a new file called CheckEntry IDEMA and put it in the same directory as the other system files.
The new file will use a function called CheckEntry, and we’ll make a variable called signal that will be used to return our calculated signal at the end of the function.
We’ll also need an array to store price information for a few candles.
Now, we use Array set as Series to sort our array starting with the current candle and going down.
With copy rates we fill our price array with data.
We do it for the current symbol and the currently selected period, starting from the current candle 0 and copy the data for 3 candles to store them in our price array.
For the indicator we need a new array that we also need to sort downwards by using array set as series.
Let’s keep going and define what our function is. For this, MQL5 has a built-in function called IDEMA.
There must be 5 parameters defined. The first two are for the current symbol and period on the chart, and the third is for the calculation period. It is 14 in our case.
Parameter 4 is for a potential candle shift, we set it to 0.
And the last parameter defines that we are going to calculate the result based on close prices.
With copy buffer we can now fill our Array with price data according to our definition. We do that for buffer 0, starting from the current candle and store the prices for 3 candles.
Afterwards, you can now get the value for the current candle by looking at that price array and, in particular, the value for candle 0.
We can now figure out the buy signal.
When the red line is below the close price for candle 1, we want to use that as a sign to buy.
So let’s give our signal the word “buy.”
In the other case, we want to sell whenever the red line is above the close price of candle 1.
At that point, we want to give the signal variable the value “sell.”
At the end of the function, please use the return function to send the calculated value back to our main module.
The entry module is now finished. Save it right away.
Then you need to open the main file and look for the part where you need to add the entry signal.
You can do that by putting the file name for our entry signal after the include statement.
Please disable any other entry signal by putting two slashes in front of it.
When you’re done, you can compile the main module and the entry module you just made by pressing F7 or clicking the compile button.
If everything went well, you shouldn’t get any errors!
If you do, please look at the error messages and try to figure out what they mean.
On MQL5.com, you can find a list of all of these error codes.
Okay, by now you should have a working for the double exponential moving average indicator that we see on our chart. I would like to say thank you for watching this video and I will see you in the next one.
 Not sure what to do? Click on the automated trading assistant below
OR CLICK HERE TO BUY NOW

- MQL5 TUTORIAL - PLATIN SYSTEM - MACD OSCILLATOR
- MQL5 TUTORIAL - PLATIN SYSTEM - ADVANCED MOVING…
- MQL5 TUTORIAL - PLATIN SYSTEM - DEMARKER OSCILLATOR
- MQL5 TUTORIAL - SIMPLE IDEMA STANDALONE EXPERT ADVISOR
- MQL5 TUTORIAL - PLATIN SYSTEM - STOCHASTIC OSCILLATOR
- MQL5-TUTORIAL-PLATIN-SYSTEM-THE-AWESOME-OSCILLATOR
