

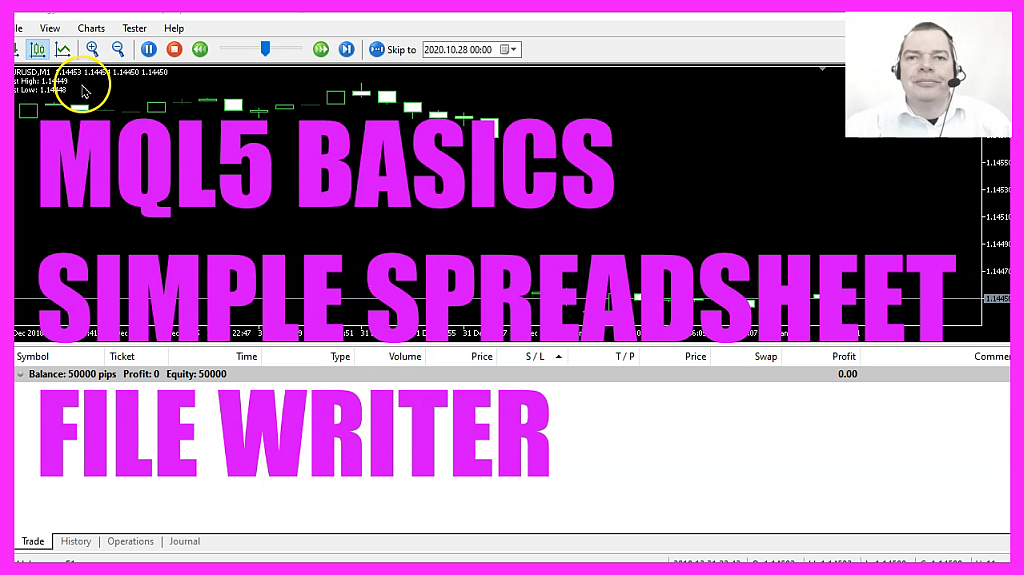
In this video, we are going to write price data into a spreadsheet like this one right out of MQL5. So let’s find out how to do that. To get started, please click on the little icon here, or press F4 on your keyboard. Now you should see the meta editor window and here you want to click on File, New File, Expert Advisor from template, Continue. I will call this file, SimpleSpreadsheetWriter, click on Continue, Continue and Finish. Now you can delete everything above the OnTick function and the two comment lines here. We start by creating static variables for the last high and the last low. A static variable will remember the value inside of this function for as long as our Expert Advisor is running. Afterwards, we use MqlRates to create a price info array. Because MqlRates is a structure that stores the information about prices, volumes, and spread.
Afterwards, we use ArraySetAsSerries to solve the price info array from the current candle downwards. And now we can fill the array by using CopyRates. For the current symbol on the chart and the currently selected period on that chart, we want to start with candle zero and copy the price data for three candles into our price info array. Now let’s check if we have a new candle, and that would be the case if the value for last high is different than the high value for candle one in our price info array. And we also want to check if the last low value is different than the low value for candle one in our price array.
Now we can start to write our file, and to do that we first need to define a name for the file. I will call this file, spreadsheet.csv, CSV is a file extension that is recognized by most spreadsheet calculation programs like Excel or LibreOffice. I think it stands for Comma Separated Values. Now that we have defined the name we want to open the file. That can be done by using FileOpen. And FileOpen will try to open the file and if it doesn’t exist, it will create one for the name of our spreadsheet that we have defined here, and we need to pass a few parameters, FILE_READ and FILE_WRITE will open the file for read and write access. This is the file mode, it is called FILE_CSV, and we are going to use the ANSI mode to write the file.
Now, when you mark that and press F1, you will learn that we can use ANSI mode or Unicode mode. Unicode would be necessary for special characters like German Umlauts. But as we are going to use simple texts and a few numbers , ANSI is okay, we are going to write a CSV file, but you could also create a text file. And if we have been able to open the file, we now need to go to the end of the file, that can be done by using FileSeek. For our file handle that we have created here, we start with the first entry that’s index zero, and we want to seek the end of the file, seek end will do that and will take us to the last character in the file. I want to do that because I want to append the values and not delete the former content of the file. And that can be done by using FILE_WRITE.
For the spreadsheet file handle, we are using commas. I’m going to write a descriptive text followed by the value for the candle one in our price info array. And the first one is the time. This will create a time stamp, followed by the description high for the high price of candle one in our price info array, and afterwards the low for candle one, you could append further values if you are interested. For example, for the open and the close price. After we have written the content, we want to use FileClose to close our spreadsheet until the next candle comes up. And to find out if the candle has changed, we are now going to assign the high price for candle one in our price info array to the variable last high, and the low price for candle one in our price info array to the last low, because the current values for candle one will be the last values the next time this function is called.
Let’s add a comment statement here for the last high and the last low. So we have a chart output while the Expert Advisor is running, and that’s basically it. If this was too fast for you, or if you have no idea what all the code here does, maybe you want to watch one of the other basic videos, or maybe even the premium course on our website might be interesting for you. For now, we want to click on View, ToolBar and click on Compile or press F7. That should work without any errors and if that is the case, you can click on the button here or press F4 to go back to MetaTrader. And in MetaTrader you’ll want to click on View Strategy Tester or press control and R. Please pick the new file, SimpleSpreadsheetWriter.ex5, mark the option for the visual mode and start your test.
Now our StrategyTester is running and we see that we have two, three candles so far. So let’s speed that up a little bit. Stop the test, and here is my spreadsheet.csv file. It’s located in my user folder. It depends on your operating system, but in my case, it’s below AppData, Roaming, MetaQuotes, Tester, inside of a folder that is called MQL5 Files. You could also specify a file path if this kind of folder is too long for you. Now let’s double click on the file, and here we see that the CSV extension automatically will show the separated values here. I will confirm that with Okay. And here is the spreadsheet that we have written right out of MetaTrader 5. So our little Expert Advisor is working as expected. And In this little video, you have learned how to create a spreadsheet with a self written Expert Advisor, and you have coded it yourself with a few lines of MQL5 code.
 Not sure what to do? Click on the automated trading assistant below
OR CLICK HERE TO BUY NOW

- MQL5 Tutorial - Simple Moving Average Calculation
- MQL5 TUTORIAL BASICS - 126 SIMPLE RUNNING TIMER
- MQL5 TUTORIAL - SIMPLE MOUSE CLICK EVENT
- MQL5 TUTORIAL BASICS - 114 SIMPLE SHIFTED PRICE EA
- MQL5 TUTORIAL - COPILOT AI PROGRAMMING (WITH SOME ISSUES)
- MQL5 TUTORIAL BASICS - 121 SIMPLE RSI SELL STOP LOSS
