

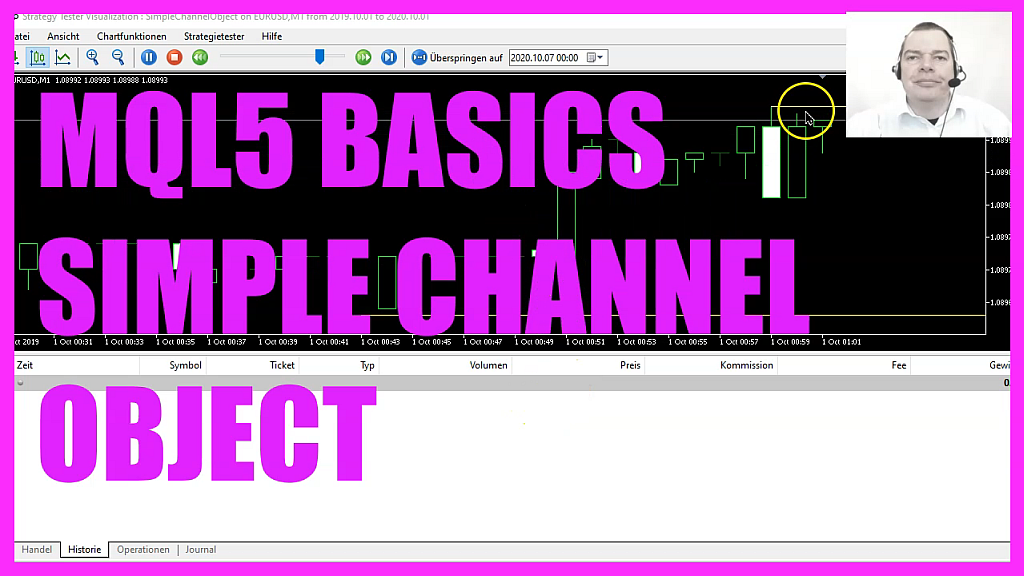
In this video, we are going to create a channel object for the highest and the lowest candle on the chart, so let’s find out how to do that with mql5.
To get started please click on the little icon here or press F4 on your keyboard, now you should see the Metaeditor window and here you want to click on file, new file, expert advisor from template, continue, I will call this file simple channel object, click on continue, continue and finish.
Now you can remove everything above the ontick function and let’s also remove the two comment lines here.
We want to start by calculating the candles on the chart that is done by using chart get integer for the chart id zero and we use chart first visible bar, the last parameter here is for the sub-window, the one with the candles is window zero, if you would like to insert oscillators like the MACD you would see that those are drawn in a separate window below but we want our channel object to be drawn in the main window.
Let’s create a variable for the lowest candle and we also need an array that is called low and it will hold the lowest candle prices for all the candles on the chart. We repeat that and create a variable for the highest candle and an array for the highest candle prices on the chart.
And now we use array set as series for both arrays to sort them from the current candle downwards, so we can fill them with data that is done by using copy low, if you mark that and press F1 you will see that we will get the historical data and the minimal prices for each candle for the current symbol on the chart and the currently selected period on that chart starting from the current candle zero for all the candles on the chart and the results will be stored in the low array that is for the lowest prices.
And as you might have guessed there is another function called copy high that will give us the highest bar prices for the history data for the current symbol on the chart and the currently selected period starting from candle zero for all the candles on the chart.
And that’s how we store those price values into our high array but now we want to find the extreme prices.
For the lowest candle that can be done by using the function array minimum that will search for the lowest value in the whole array, in our case in the array called low starting from candle zero for all the candles on the chart and the price for the lowest candle will be stored in this variable.
For the highest candle we use array maximum that will give us the largest element or the highest price in our array and this is the high array starting from candle zero for all the candles on the chart so now we have the number for the lowest and for the highest candle but we need more data, so we use mql rates to create a price information array, if you mark mql rates and press F1 you will see that it stores information about prices, volumes and spread and also the time and that’s what we need, so let’s use array set as series to sort the price information array from the current candle downwards and with copy rates we fill the array for the current symbol on the chart and the currently selected period on that chart starting from candle zero for all the candles on the chart and store the values in our price information array.
Before we can draw the object we want to use object delete for the current symbol on the chart to delete any formal objects called simple channel object. We will not have such an object the very first time we call the code but afterwards, we want to make sure that we remove the old values before we draw a new object and to draw that object we use object create, if you mark that and press F1 you will learn that it can take up to thirty coordinates, we need to pass a few parameters, so let’s go through the values one by one.
The first parameter is for the current symbol on the chart, the second one is for the name of the object, I have called it simple channel object, you can call it whatever you want as long as you use the same name everywhere, parameter three is called obj channel in our case and if you mark that and press F1 you will see that we have lots of different object types even different channel types, in this case, we are using this one and we want to draw the first line for the lowest candle and this is the point in time where we want to start, in this case, it would be this candle because here we have the date time values and the line should be drawn for the lowest price of the lowest candle.
I want it to be drawn up to the current candle, this is the second time point and here I repeat the parameter that I have used here that will make it a horizontal line, the second line should start at the time that the highest candle was drawn. In this example, it would be here, this candle. And I want the second line to be drawn for the highest price of the highest candle that was the object creation.
Now let’s change a few properties for our object! That is done by using object set integer for the chart id zero and the object that is called simple channel object, I want to change the object property color and set it to yellow. Now we repeat that and change object property style, I would like to see a solid line, so I use style underscore solid. With object property width we can change the thickness for the line and the last property is called object property ray right and this will give us a kind of preview because the line will be drawn through the current candle and into the future.
That’s about it.
If this was too fast for you or if you have no idea what all the code here does maybe you want to watch one of the other videos in the basic video series or maybe even the premium course on our website might be interesting for you, for now, we click on view, toolbar and click on compile or press F7, that should work without any errors and if that is the case you can click on the little button here or press F4 to go back to Metatrader.
And in Metatrader you want to click on view, strategy tester or press control and r, please pick the new file, simple channel object dot ex5, mark the option for the visual mode here and start a test.
Currently, it doesn’t work, looks like I have missed something, so let’s mark object create and press F1 and it looks like I have missed a parameter here, so the object isn’t working because I have not told Metatrader where to draw the object, it should be drawn in the candle chart that’s the sub-window zero, so let’s fix that, recompile the code, restart the test and here is the channel object.
Let’s zoom out and zoom in and you will see that the channel object is working as expected now and in this little video you have learned how to create a simple channel object and you have coded it yourself with a few lines of mql5 code.
 Not sure what to do? Click on the automated trading assistant below
OR CLICK HERE TO BUY NOW

- MQL5 TUTORIAL BASICS 127 - SIMPLE ELLIPSE OBJECT
- MQL5 TUTORIAL- SIMPLE ICCI STANDALONE EA
- MQL5 Tutorial - Advanced Trading Range Calculation
- MQL5 Tutorial - Simple Chart Objects
- MQL5 TUTORIAL - SIMPLE ICCI EXPERT ADVISOR
- MQL5 TUTORIAL - SIMPLE MOUSE CLICK EVENT
