

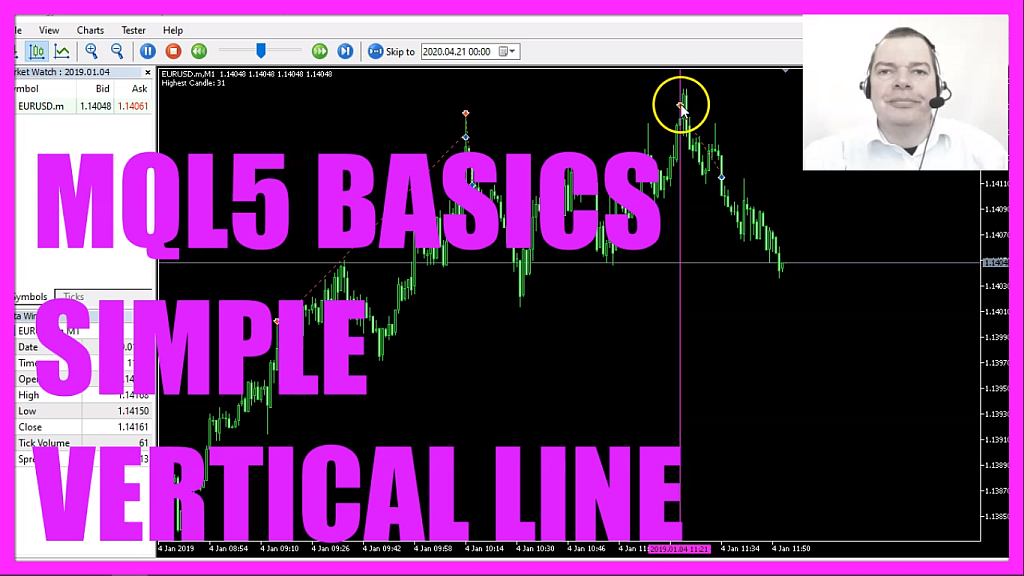
In this video we are going to draw vertical lines whenever we open a sell trade, this one is because we have calculated that the last candle was the highest candle, so let’s find out how to do that with mql5.
To get started please click on a little icon here or press F4 on your keyboard and here you want to click on file, new file, expert advisor from template, continue, I will call this file simple vertical line, click on continue, continue and finish.
Now you can delete everything above the ontick function and the two comment lines here, we start with an include statement to include the file trade dot mqh that contains a class called ctrade and we are going to create an instance called trade.
Inside of the ontick function we start by calculating the bid price that is done by using symbol info double for the current symbol on the chart, we use symbol underscore bid and with normalize double and underscore digits we automatically calculate the right number of digits behind the dot.
Let’s create an array for price information that can be done by using the function mql rates, now we sort the array from the current candle downloads by using array set as series for our price information array and with copy rates we fill our array for the current symbol and the currently selected period with price data starting from the current candle zero. We want to copy the price data for one hundred candles and store it in our price information array.
I would like to sell when we have the highest candle out of the last one hundred candles, so let’s create a variable called highest candle and we also need to create an array for the highest candle prices. Let’s use array set as series for that array to also sort this one from the current candle downwards and to get the highest prices we use copy high for the current symbol on the chart and the currently selected period on that chart to copy the high prices for each candle starting with candle zero for one hundred candles and we store those values in the high array. That makes it possible to get the highest candle by using a function called array maximum, this will give us the largest element in our array in our case that’s the number for the highest candle and if the highest candle on the chart is the current candle and if positions total delivers a return value of zero that’s when we want to sell so we now use trade dot sell to sell ten micro lot.
Afterwards, I would like to use a user-defined function to draw a vertical line but before we are going to code it let’s add a comment statement to output the text, highest candle, followed by the number of the highest candle out of the last one hundred candles that is the output that you can see right here.
Now let’s find out how to draw that vertical line!
Our user-defined function will have no return value so we use void here, it doesn’t take any parameters and we start by using object delete for the current symbol on the chart to delete the formal line that we have drawn because we only want to see one line on the chart, the other lines have been deleted.
Afterwards, we use object create for the current symbol on the chart to create an object that is called line, the type of the object is obj underscore v line for vertical line, if you mark that and press F1 you will see that there are lots of other object types here, the object will be drawn in our main chart, we use time current because that will give us the time of the last received tick or price change if you want, if you look inside of the mql5 reference you will see all the parameter descriptions here and we can change some object properties, so let’s do that for the current color, we use object set integer on the main chart zero for an object called line, the property for the color and set it to clr magenta. If you press F1 you will see that there are lots of predefined colors. Let’s also change the object width, in my case, I will set it to one and that’s about it.
If this was too fast for you or if you have no idea what all the code here does maybe you want to watch one of the other videos in this basic video series first or maybe even the premium course on our website might be interesting for you. This actually was a suggestion of a premium course member and if you are already a premium course member and have an idea for a video like this one please let me know.
For now, we click on the compile button here or press F7, I have no errors and if this is the case you can click on the little button here or press F4 to go back to Metatrader.
And in Metatrader, we click on view, strategy tester or press control and r, please select the new file, simple vertical line dot ex5, mark the option for the visual mode here and start a test.
Here we are! So far we don’t see any lines here because the highest candle is not candle zero so, let’s speed that up a little bit, here we have a vertical line that was the highest candle at that time so our little expert advisor is working as expected and in this little video you have learned how to draw a vertical line whenever you open a sell position and you have coded it yourself with a few lines of mql5 code.
 Not sure what to do? Click on the automated trading assistant below
OR CLICK HERE TO BUY NOW

- MQL5 TUTORIAL BASICS 127 - SIMPLE ELLIPSE OBJECT
- MQL5 TUTORIAL BASICS - 114 SIMPLE SHIFTED PRICE EA
- MQL5 TUTORIAL - SIMPLE STOCHASTIC STANDALONE EXPERT ADVISOR
- MQL5 TUTORIAL- SIMPLE ICCI STANDALONE EA
- MQL5 TUTORIAL - SIMPLE AWESOME STANDALONE EXPERT ADVISOR
- MQL5 TUTORIAL - SIMPLE AMA STANDALONE EXPERT ADVISOR
