

In this video we are going to create an expert advisor that is able to change the background color based on buy and sell signals, so let’s find out how to do that with mql5.
To get started please click on the little icon here or press F4 on your keyboard, now you should see the Metaeditor window and here you want to click on file, new file, expert advisor from template, continue, I will call this file simple background color, click on continue, continue and finish.
Now you can delete everything above the ontick function and the two comment lines here, first we need to get the ask price, this is done by using symbol info double, for the current symbol on the chart we use symbol underscore ask and with normalize double and underscore digits we make sure that the number of digits behind the dot is automatically calculated that could be either three or five digits depending on the currency pair.
Now we repeat the process using symbol underscore bid this time to calculate the bid price and we also need to create a string, this will be called signal and we don’t assign a value here because we are going to calculate that now.
Our expert advisor is going to use a moving average, so the first thing to do is to create a moving average array, this is going to hold our values and we use the included ima function that comes with mql5 to create a moving average for the current symbol on the chart and the currently selected period.
Our moving average is going to calculate the values based on the last twenty candles, we start with the current candle, the method should be mode underscore sma for simple moving average and we calculate the values based on the close price.
Afterwards, we use array set as series to sort the array from the current candle downwards and with copy buffer we fill our moving average array according to the definition that we have created here, for one line, we start with candle zero that’s the current candle and we copy the values for three candles and afterwards, we can get the moving average value by just looking into candle zero of our moving average array.
And if that value is below the bid price we consider that to be a buy signal so we assign the word buy to our signal and for a buy signal we are going to call a function called, set chart color background and set the color to green.
In the other case if the value for the moving average is above the ask price we consider that to be a sell signal so now we assign the word sell to our signal and we call the background color function and set the background color to red.
Let’s add a third condition, if the value for m a moving average is below the ask price and above the bid price that would mean that we have no signal so we set the value for our signal to none and in that case we would like to call the custom function and set the background to black.
Well, if you mark that and press F1 you will see that there are lots of other colors that you could choose but this function doesn’t exist so far so we need to create it in a few seconds, let’s add a chart output by using the comment statement and that will show us the text, the current signal is and the calculated signal directly on our chart.
Now let’s create the custom function, it doesn’t return a value so we use void here, the name of the function is set chart color background and it takes a parameter, this one is of the type color, I have called it background color but you can call it whatever you like and inside that function, we are going to use chart set integer for the current symbol on the chart, we want to set the color so we use chart underscore color underscore background – all in capital letters – and the last parameter here is the background color that we have passed here.
And that’s about it.
Well, if this was too fast for you or if you don’t understand what all the code here does maybe you want to watch one of the other basic videos first or maybe the premium course on our website might be interesting for you. This again was an idea of a premium course member, and if you are a premium course member and have an idea for such a video please send me an email. For now, we click on the compile button or press F7, you shouldn’t get any errors here and if this is the case you can click on a little button here or press F4 to go back to Metatrader.
And inside of Metatrader, we click on view, strategy tester or press control and r, please pick the new file, simple background color dot ex5, enable the visual mode here and start a test.
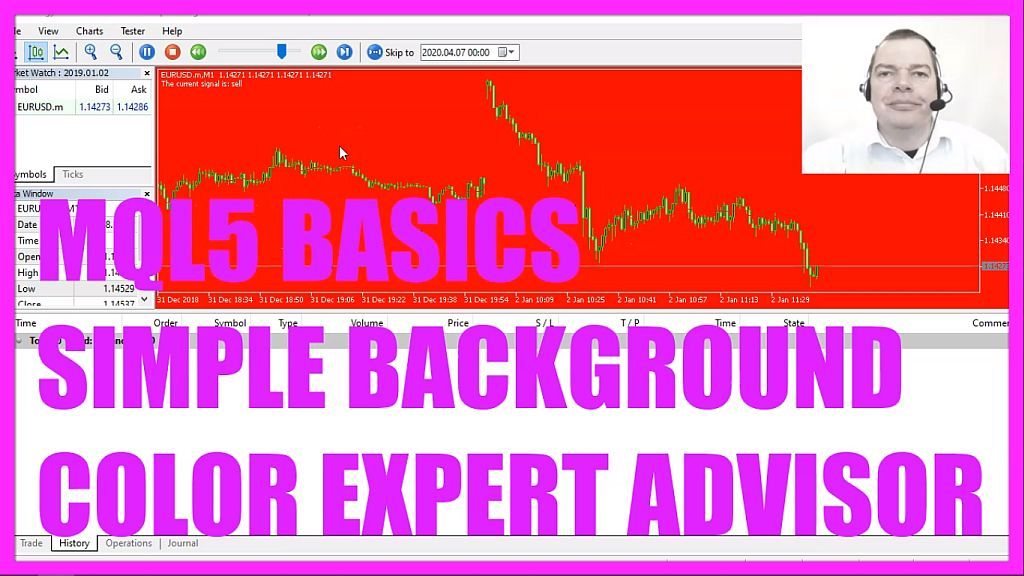
This is how it looks like. Currently, we have a sell signal and when it changes to buy we see that the background color also changes and in this little video you have learned how to create an expert advisor that is able to change the background color based on buy and sell signals and you have coded it yourself with a few lines of mql5 code.
 Not sure what to do? Click on the automated trading assistant below
OR CLICK HERE TO BUY NOW

- MQL5 TUTORIAL BASICS 127 - SIMPLE ELLIPSE OBJECT
- MQL5 TUTORIAL - COPILOT AI PROGRAMMING (WITH SOME ISSUES)
- MQL5 Tutorial - Simple Chart Objects
- MQL5 TUTORIAL BASICS - 126 SIMPLE RUNNING TIMER
- MQL5 TUTORIAL - SIMPLE MOUSE CLICK EVENT
- MQL5 TUTORIAL BASICS - 114 SIMPLE SHIFTED PRICE EA
