

- Introduction to the Commodity Channel Index Expert Advisor (00:00 – 00:14) Introduction to creating an expert advisor to trade using the Commodity Channel Index (CCI) as a basis for buy and sell signals.
- Starting in MetaEditor and Creating a New Expert Advisor File (00:14 – 00:27) Instructions on opening MetaEditor and creating a new expert advisor file named “Simple Commodity Channel Index.”
- Setting Up the Code Structure and Including Necessary Files (00:27 – 01:04) Deleting unnecessary code and including the ‘trade.mqh’ file for simple trading functions.
- Defining Variables for Prices and Creating a Price Data Array (01:04 – 02:05) Defining variables for ask and bid prices, creating an array for price data, and filling it with data for three candles.
- Defining the Commodity Channel Index Indicator (02:05 – 03:24) Creating a price array and defining the CCI indicator for the current symbol and period based on fourteen candles and the close price.
- Calculating the Current CCI Value and Setting Buy/Sell Signals (03:24 – 04:29) Calculating the current CCI value and setting conditions for buy and sell signals based on the CCI value crossing specific thresholds.
- Executing Trades Based on CCI Signals (04:29 – 04:56) Using ‘trade.sell’ and ‘trade.buy’ to execute trades based on the CCI signals, ensuring no open positions exist.
- Outputting the Signal and Finalizing the Code (04:56 – 05:09) Using the ‘comment’ function to output the current signal on the chart.
- Compilation and Testing in MetaTrader (05:09 – 06:00) Instructions on compiling the code and testing the expert advisor in MetaTrader using the strategy tester.
- Demonstration of the Expert Advisor in Action (06:00 – 06:22) Demonstrating the expert advisor in MetaTrader, showing trades being executed based on the CCI indicator signals.
In this video we are going to create an expert advisor to trade this oscillator, it’s the commodity channel index, usually, it’s used as a filter but in this case, we are going to use it to create buy and sell signals, so let’s find out how to do that with mql5.
To get started please click on the little icon here or press F4 on your keyboard and here you want to click on file, new file, expert advisor from template, continue, I will call this file simple commodity channel index, click on continue, continue and finish.
Now you can delete everything that is above the on tick function and let’s also remove the two comment lines here.
We start with an include statement to include the file trade dot mqh, this one comes with mql5 and it will give us some simple options to open positions.
We want to use a class called ctrade and we are going to create an instance called trade.
Inside of the on tick function we use symbol info double for the current symbol on the chart to get the ask price, that is done by using symbol underscore ask, please all in capital letters and with normalize double and underscore digits we calculate the right number of digits behind the dot.
Let’s repeat that for the bid price. This time the variable name is different and we use symbol underscore bid but everything else is pretty much the same.
With mql rates we create an array for the price data and we use array set as series to sort the array from the current candle downwards and with copy rates we fill the array for the current symbol and the currently selected period on the chart with price data for three candles.
Actually, this expression and this one are the same, if you mark this function and press F1 you will see both expressions do the same, so let’s actually do that and this is also true for the period.
Now we need an empty string that will be called signal because it will contain the signal, we don’t assign a value here because that’s’ what we are going to calculate now.
So let’s create a price array and define the commodity channel index that can be done with the included function icci that comes with mql5.
We do it for the current symbol on the chart and the currently selected period on that chart.
It will be calculated based on fourteen candles and on the close price and that’s actually what you will see when you right-click the oscillator and click properties.
Fourteen candles and the close price are the standard parameters.
We use array set as series to sort this one also from the current candle downwards and with copy buffer we fill our price array according to the definition that we have created here.
We do it for buffer zero – that’s the indicator line here – and we start with the current candle zero, we just need data for three candles and store everything in the price array. That makes it possible to calculate the current cci value by looking into candle zero of the price array and if the current value is above the plus one hundred line – that is this dotted line here – we consider that to be a sell signal so we assign sell to our signal.
Otherwise, if the value is below the lower dotted line – that would be this one – we want to buy so now we assign the word buy to our signal.
And if our signal equals sell and if the return value for positions total is below one, or in other words, we don’t have any open positions we use trade dot sell to sell ten micro lot.
In the other case if the signal equals buy and positions total is below one we use trade dot buy and buy ten micro lot.
Finally, we want to create a chart output, we use the comment function to do that. It will output the text the current signal is and the calculated signal.
That’s about it.
If you don’t understand what all the code here does or if this was too fast for you, you probably want to watch the other videos in this basic series first or maybe even the premium course on our website might be interesting for you. For now please click on the compile button or press F7, you shouldn’t get any errors and if that is the case you can click on the little button here or press F4 to go back to Metatrader.
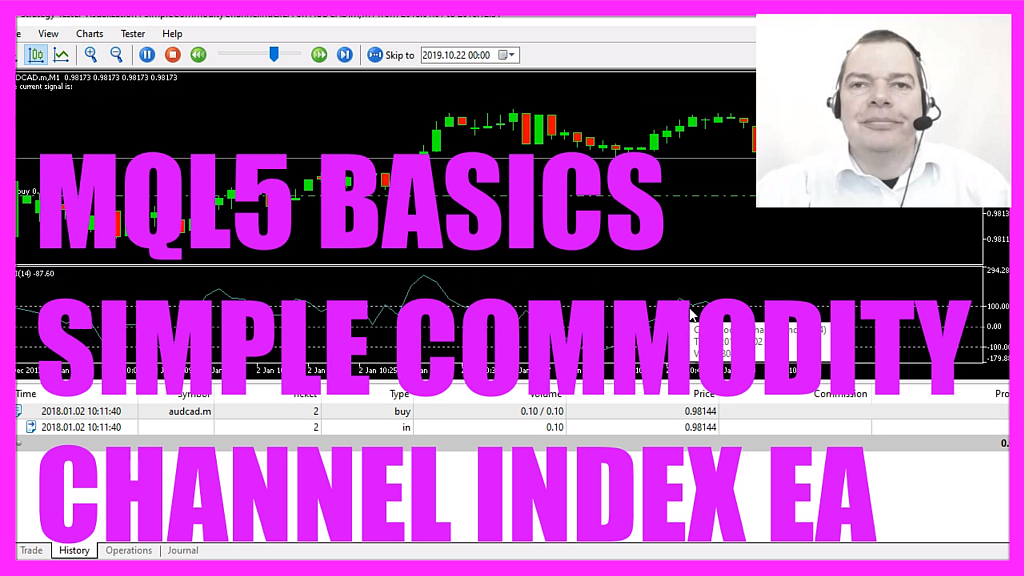
In Metatrader you want to click on view, strategy tester or press control and r, please pick the new file simple commodity channel index EA dot ex5, mark the option for the visual mode here and start a test.
And here we are! We should see a trade as soon as the line is crossed, here is our first buy trade and in this little video you have learned how to create an expert advisor for the commodity channel index that is able to open buy and sell trades and you have coded it yourself with a few lines of mql5 code.
 Not sure what to do? Click on the automated trading assistant below
OR CLICK HERE TO BUY NOW

- How to create a commodity channel index EA with MQL5
- MQL5 TUTORIAL- SIMPLE ICCI STANDALONE EA
- How to create an ICCI Expert Advisor with MQL5
- MQL5 TUTORIAL - SIMPLE ICCI EXPERT ADVISOR
- MQL5 Tutorial - How To Code A Simple Commodity Channel Index
- How to create a force Index EA with MQL5
