

- Introduction to Calculating a Simple Moving Average in MQL5 (00:00 – 00:12)
- Introduction to the tutorial’s objective: calculating the value for a Simple Moving Average (SMA) and outputting it on the chart using MQL5.
- Opening MetaEditor and Creating a New File (00:12 – 00:34)
- Instructions on opening MetaEditor in MetaTrader and creating a new Expert Advisor file named “SimpleMovingAverage”.
- Setting Up the Code Structure (00:34 – 00:45)
- Steps to clean up the code by removing unnecessary parts and starting with the creation of an array for the SMA.
- Defining the Moving Average with iMA Function (00:45 – 01:12)
- Using the integrated MQL5 function ‘iMA’ to define the Moving Average, with parameters for the symbol, period, and number of candles.
- Configuring Parameters for Moving Average Calculation (01:12 – 02:02)
- Setting up parameters for the Moving Average, including the time frame, number of candles (20), and calculation based on the close price.
- Filling the Moving Average Array with Data (02:02 – 02:58)
- Using ‘CopyBuffer’ to fill the Moving Average array with data based on the defined Moving Average parameters.
- Calculating the Moving Average for a Specific Candle (02:58 – 03:12)
- Calculating the Moving Average for the last complete candle (candle 1) and storing it in a variable.
- Outputting the Moving Average Value on the Chart (03:12 – 03:34)
- Using the ‘Comment’ function to display the calculated Moving Average value on the chart.
- Compiling the Code and Testing in MetaTrader (03:34 – 04:12)
- Compiling the code in MetaEditor and testing the Expert Advisor in MetaTrader using the Strategy Tester.
- Observing the Moving Average and Output on the Chart (04:12 – 04:54)
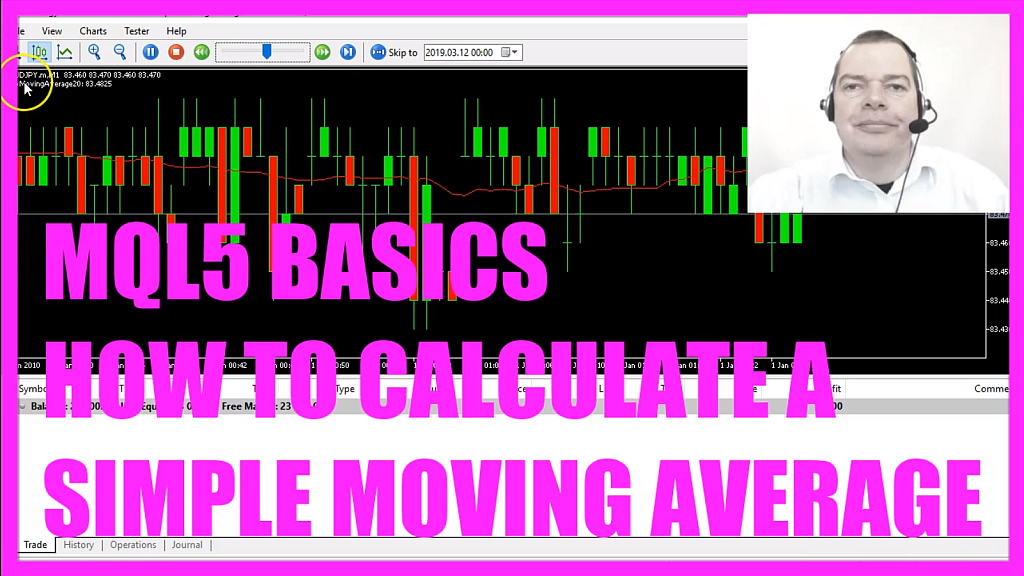
- Observing the Moving Average (red line) on the chart and the calculated value displayed in the upper left corner.
In this video want to calculate the value for a Simple Moving Average and output the value on the chart, so let’s find out how to do that with MQL5.
Please click on the little button here or press F4 in Metatrader, now you should see the Metaeditor window and here you want to click on: “File/ New/ Expert Advisor (template)” from template, “Continue”, I will call this file: ”SimpleMovingAverage”, click on “Continue”, “Continue” and “Finish”.
Now you can delete everything above the “OnTick” function and the two comment lines here.
We start by creating an array for the Simple Moving Average (myMovingAverageArray) and you can think of an array like a raw of boxes that contain values.
Let’s continue with the definition of the Moving Average (movingAverageDefinition), we use the integrated MQL5 function: “iMA”, if you highlight it and press F1 you will see that it needs a few parameters; the first parameter “_Symbol” is used to automatically find out what kind of symbol is used on the chart – in my case it’s the currency pair: Australian Dollar against Yen – the second parameter “_Period” contains the value of the time frame that is used on the current chart – I’m using the M1 chart for one minute candles right now – the third parameter is the number of candles that we are going to use to calculate the Moving Average, in our case we use 20 candles.
When you put your mouse over the Moving Average you will see 20 in round braces behind the Moving Average behind here (Moving Average (20)) that stands for 20 candles.
This parameter here is the starting point; we will start the calculation based on the current candle 0 (zero), we use “MODE_SMA” to calculate a Simple Moving Average and we use “PRICE_CLOSE” in the last parameter because we want to calculate the Moving Average values based on the close price.
Now we use “CopyBuffer” to fill our Moving Average array (myMovingAverageArray) with data based on the Moving Average Definition (movingAverageDefinition) that we have created here, we start from candle 0 (zero), we do it for buffer 0 (zero) – that’s the red line here, the only Indicator line that we have for a Moving Average. The Bollinger Bands Indicator for example would have 3 lines, so that would be buffer 0 (zero), 1 or 2, we start with the current candle 0 (zero) and we copy the price data for three candles and store it in our array (myMovingAverageArray).
To calculate the Moving Average for candle 1 – that’s the last complete candle that appears on the chart – we can use the value for candle 1 in our Moving Average array (myMovingAverageArray) and store it in a variable called: “myMovingAverage20”.
Finally we want to use the “Comment” function to create an output on the chart, saying: “MyMovingAverage20:” followed by the value that we have calculated, that’s it so far.
Now you can click on the “Compile” button or press F7 on your keyboard – I’m getting a warning here: “possible loss of data due to type conversion” because I am using a floating type (float), that means we have less digits behind the dot but for our simple example that should be enough – so when you are done and when you don’t have any errors, you can click on the little button here or press F4 to go back to Metatrader.
In Metatrader we want to click on: “View/ Strategy Tester” or press CTRL and R, please pick the new file: ”SimpleMovingAverage.ex5”, mark the visualization option here and start a test.
Now you should see the Moving Average, it’s the red line here on the chart and in the left upper corner we have the calculated value, so let’s have a look at the value for the Moving Average – remember we have calculated it for a candle 1 – in my case it is 83.4845, that’s exactly what we have here in our value and in this little video you have learned how to calculate the values for a Moving Average and how to create an output on the chart and you have done it with a few lines of MQL5 code.
Download “CODE - SIMPLE MOVING AVERAGE CALCULATION”
SimpleMovingAverage.mq5 – Downloaded 35 times – 599.00 B Not sure what to do? Click on the automated trading assistant below
OR CLICK HERE TO BUY NOW

- MQL5 Tutorial - Simple Moving Average Calculation
- MQL5 TUTORIAL - HOW TO CREATE A SHIFTED MOVING AVERAGE
- MQL5 Tutorial Classics - Simple Moving Average Robot…
- MQL5 TUTORIAL - SIMPLE SHIFTED SMA EXPERT ADVISOR
- How to create an Adaptive moving Average EA with MQL5
- MQL5 TUTORIAL - SIMPLE IDEMA STANDALONE EXPERT ADVISOR
