

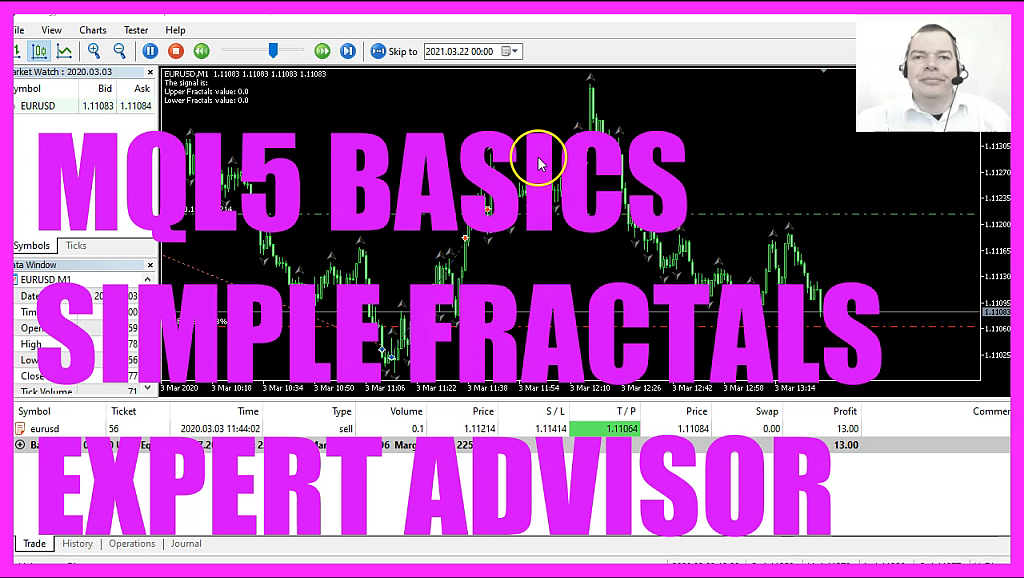
In this video, we are going to create an Expert Advisor that is able to calculate this indicator here, it’s the fractals indicator. So let’s find out how to do that with MQL five. To get started, please click on a little icon here or press F4 on your keyboard. Now you should see the Metaeditor window and here you want to click on file. New file, Expert Advisor from template, continue. I will call this file simple fractals Ea. Click on Continue, continue and finish.
Now you can delete everything above the ontick function and let’s also remove the two comment lines. We will start with and include statement that will include the file Trade.mqh. This one is part of MQL five and it will allow us to create an instance of the class Ctrade, that is called trade, and we are going to use it to open some positions later. Inside of the ontick function we need to calculate the Ask price and the Bid price, that is done by using Symbolinfodouble for the current symbol on the chart, we use either symbol ask or symbol bid, and with normalize double and underscore digits, we can automatically calculate the right number of digits behind the dot for each currency pair. The next thing we need is a variable for the signal. This will also be called signal, but we don’t assign a value here. Afterwards, we use MQLRates to create a price array and with arraysetasseries, we sort our price array from the current candle downwards.
And now we can fill the array with price data, that is done by using CopyRates for the current symbol on the chart and the currently selected period on that chart, copy the data for three candles and store them in the price array. But let’s use the underscore. It doesn’t really matter because when you mark that and press F1, you will see that it is interchangeable. We need two more arrays, one for the upper fractals and one for the lower fractals.
The definition is very easy. We use the function I fractals for the current symbol on the chart and the current period on that chart. Our two fractal arrays need to be sorted by using arrays set as series as we did here. Now we can fill in some data, that is done by using copybuffer for the fractals definition that we have created here. The first one is for the upper line, we are starting with candle one for three candles and store the values in the upper fractals array, for the lower fractals array it’s very similar, but this time we are using lower underscore line and store the values in the lower fractals array. Here comes something that is very uncommon, because if the upper fractals value is equal to empty underscore value, we will assign the value zero to our upper fractals value. And we do the same thing here for the lower fractals value. If you missed that part, you might see some strange exponential values on your chart. So let’s don’t forget that. Now we can check the entry conditions.
Because if the lower fractals value is not zero, and if the lower fractals value is below the lowest price for candle one in our price array, we would consider that to be a buy signal. Therefore, we assign the word buy to our signal. Otherwise, if the upper fractals value is not zero and if the upper fractals value is higher than the highest price for candle one in our price array, that would be a sell signal. And now we assign the word sell to our signal.
And when we have a sell signal and PositionsTotal is less than one, that is equal to we have no open positions. That’s when we want to sell. And that’s when we use trade.Sell to sell 10 Microlot. In the other case, if the signal equals buy and we have no open positions, that is when we use trade.Buy to buy 10 Microlot.
Finally, we want to add a comment statement on our chart, that will output the signal, the upper and lower value for the fractals indicator, and that’s about it. Well, if this was too fast for you or if you have no idea what all the code here does, maybe you want to watch one of the other videos in the basic video series or maybe even the Premium Course might be interesting for you. That can be found on our website, where we also have a link for source codes for this basic video stuff here, but for now, please click on View, Toolbar.
And press the Compile button or F7 on your keyboard, I have made a mistake here, it looks like I have forgotten to calculate the values for the last candle. The upper fractals value can be calculated by looking at the value for candle one in our upper fractals array. The lower fractals value is calculated by looking at candle one in the lower fractals array. Now let’s recompile the code and this time it worked. And if that is the case, you can click on a little button here or press F4 to go back to Metatrader.
And in Metatrader you want to click on View, Strategy tester or press Control and R.
Please pick the new file Simple FractalsEA.ex5 mark the option for the visual mode and start your test. Here we are. The Expert Advisor is running. We see the fractals on the screen. We see buy and sell signals and the values are calculated. So our little Expert Advisor is working as expected. And in this little video you have learned how to calculate the fractals indicator and you have done it yourself with a few lines of MQL5 code.
 Not sure what to do? Click on the automated trading assistant below
OR CLICK HERE TO BUY NOW

- MQL5 TUTORIAL BASICS - 126 SIMPLE RUNNING TIMER
- MQL5 TUTORIAL BASICS - 115 SIMPLE ENVELOPESBUY TRAILING STOP
- MQL5 TUTORIAL - SimpleAverageTrueRange Walkthrough
- MQL5 TUTORIAL - SIMPLE MOUSE CLICK EVENT
- MQL5 Tutorial - Simple Moving Average Calculation
- MQL5 TUTORIAL BASICS - 120 SIMPLE RSI BUY STOP
