

In this video, we are going to create an Expert Advisor that is able to open buy and sell trades based on minimal or maximal values of this oscillator here. So let’s find out how to do that with MQL5. To do that, please click on a little button here or press F4 on your keyboard. Now, you should see the Metaeditor window and here you want to click on file. New file, Expert Advisor from template continue. I will call this file simple IOBVEA, click on continue, continue and finish.
Now you can delete everything above the ontick function and let’s also remove the two comment lines here. We start with an include statement to include the file Trade.mqh. This one comes with some simplified trading functions and it makes it possible to create an instance of the class Ctrade. That is called trade and we are going to use it to open positions. Inside of the ontick function we want to create a string variable called signal, but we don’t assign a value here.
Now we want to calculate the Ask price and the Bid price. That is done by using Symbolinfodouble for the current symbol on the chart. We use either symbol underscore ask or symbol underscore bid. And with symbolinfodouble and underscore digits, we make sure that we automatically calculate the right number of digits behind the dot. Let’s create an array for the price data and we use ArraySetAsSeries to sort it from the current candle downwards.
And now we use IOBV for the current symbol on the chart and the currently selected period on that chart. The third parameter is volume tick. And this function will give us the onbalance volume indicator, that is an oscillator. We use copybuffer to copy data into our array according to the definition that we have created here. We want to do it for buffer zero. We start with the current Candle zero and copy the data for 100 candles to store them in our array.
Now we can calculate the current value by simply looking into candle zero of the array. Let’s calculate the number of the candle that contains the highest value. That is done by using array maximum and array maximum will deliver the number of the candle in the current array, starting from candle zero for the whole array that contains the highest value. There is a similar function that is called array minimum. That will do the same and calculate the number of the candle with the minimum value. And to actually get the value, we need to get the value for the candle number that we have just calculated.
Let’s repeat that for the minimum value so that we can define the signal. Because if the current value is bigger or equal the max value, we consider that to be a buy signal. So we assign the word buy to our signal. Otherwise, if the current value is below or equal to the minimum value, we consider that to be a sell signal and now we assign the word sell to our signal. So if our signal equals sell and the return value for PositionsTotal is below one, that would mean we have no open Orders and a Sell signal.
And that’s when we use trade.Sell to sell 10 Microlot. Otherwise, if the signal equals buy and we have no open positions, that’s when we use trade.Buy to buy 10 Microlot. Finally, we want to use the comment statement to output the current the max and the MIN values directly on our chart. So this is about it. If this was too fast for you or if you have no idea what all the code here does, maybe you want to watch one of the other videos in the basic video series.
Or maybe even the Premium Course on our website might be interesting for you. That’s where you also can find a link for courses that contain the source codes here. For now, let’s click on View, toolbar and click on compile or press F7. That should work without any errors, and if that is the case, you can click on a little button here or press F4 to go back to Metatrader. And in Metatrader, we use a little trick and click on insert, indicators, volumes, on balance volume.
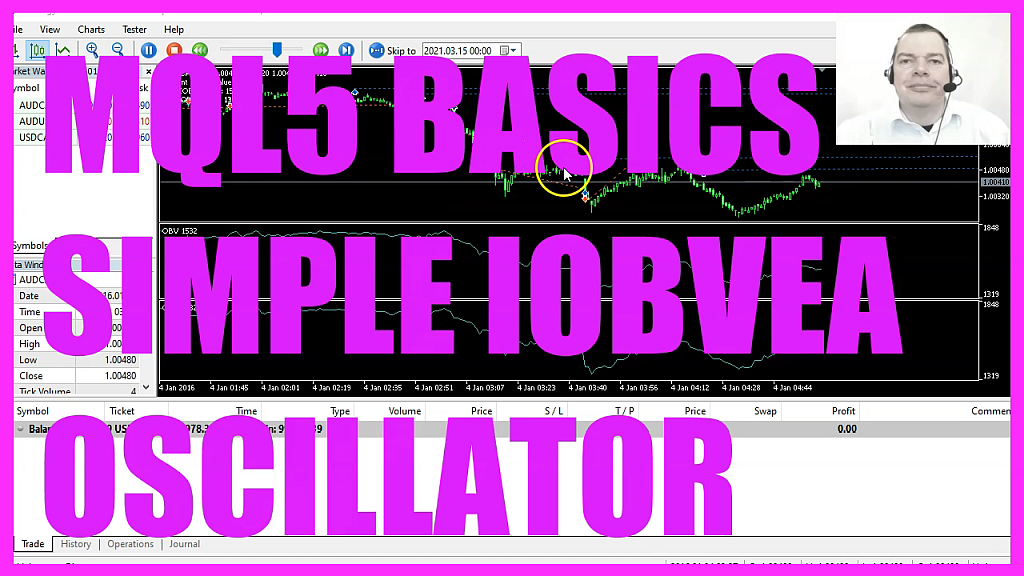
We will go with the default values. Click on OK, and here’s our oscillator. Now, let’s right click into the Chart, select templates, safe template. And save it as tester.tpl . You can override the current one, because tester.tpl is what we will see in the next strategy test, so let’s do that.
And click on View Strategy tester or press Control and R. Please pick the new file, simple, IOBVA .ex5, scroll a little bit down and enable the Visual mode here. And start your test. Here we are, our Expert Advisor is running. You see that I have two on balance volume oscillators here, that is because I have overwritten the Tester.tpl template and in this little video you have learned how to calculate the highest and the lowest value for 100 candles of an oscillator.
And you have coded it yourself with a few lines of MQL5 code.
 Not sure what to do? Click on the automated trading assistant below
OR CLICK HERE TO BUY NOW

- MQL5 TUTORIAL - SIMPLE STOCHASTIC STANDALONE EXPERT ADVISOR
- MQL5 TUTORIAL - SIMPLE AWESOME STANDALONE EXPERT ADVISOR
- MQL5 TUTORIAL BASICS - 121 SIMPLE RSI SELL STOP LOSS
- MQL5 TUTORIAL - SIMPLE MOUSE CLICK EVENT
- MQL5 TUTORIAL BASICS - 126 SIMPLE RUNNING TIMER
- MQL5 TUTORIAL - SIMPLE MACD STANDALONE EXPERT ADVISOR
