

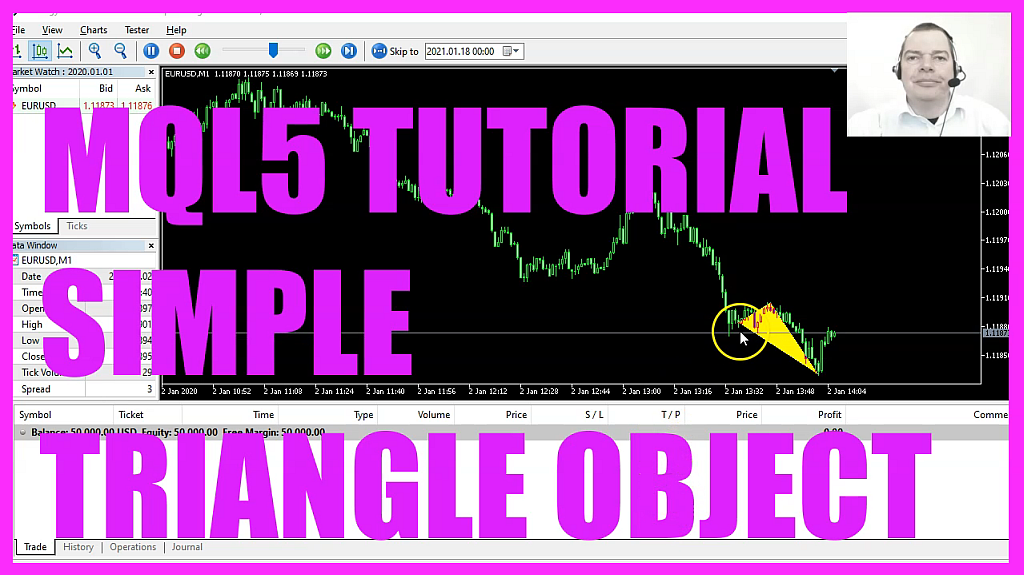
In this video, we are going to create a triangle object on the chart, you see the little yellow triangle here. This is actually an object. So let’s find out how to create it with MQL5. To do that, please click on the little icon here or press F4 on your keyboard.
Now, you should see the Metaeditor window and here you want to click on file, new file Expert Advisor from Template continue. I will call this file Simple Triangle, click on Continue, continue and finish. Now you can delete everything above the ontick function and let’s also delete the two comment lines here. We start by creating two variables for the highest and for the lowest candle. Afterwards, we want to create two arrays. Those are called high and low. And now we need to use ArraySetAsSeries to sort out arrays from the current downwards, we do that for the high array and of course, we also need to do it for the low array.
Now we want to use CopyHigh, because that will give us the highest bar prices for the current symbol on the chart and the currently selected period, starting from Candle zero for 30 candles. And it will copy the values into our high array. And you might have guessed it. Now we can do the same with CopyLow to copy the lowest values into our low array. And once we have those values, we can calculate the highest candle by using ArrayMaximum.
That will give us the largest element in our array. In this case, in the high array, starting from Candle zero for 30 candles and for the Iowest candle, we can use ArrayMinimum, that will look into the low array starting from Candle zero for 30 candles. And this will give us the lowest candle. Afterwards, we use MQLRates to create another array for price information. This one also needs to be sorted downward from the current candle downwards. Now we use CopyRates for the current symbol on the chart and the currently selected period on that chart, starting from Candle zero.
This expression here will give us all the available price information for the bars on the chart and the result will be stored in our price information array. Before we want to create a new object we use object delete for the current symbol on the chart to delete any former objects that might have the name triangle. And after we have done that, we can create a new object, that is done by using object create.
For the current symbol on the Chart ID, the object name will be triangle, the object type is OBJ underscore triangle, all in capital letters please. It will be created in our main window at the point in time where we see candle 30 for the close price from candle thirty. That’s our anchor point. And we draw it to the point in time for the Iowest candle to the lowest price of the lowest candle. And the other side will be the point in time for the highest candle and the highest price for the highest candle.
Remember, this is all for the last 30 candles. Now let’s change a few properties. That is done by using ObjectSetInteger. The first value is for the Chart ID. And zero means that we are going to do it on the current chart for the object that is called Triangle. We want to change the property that is called OBJ Prop_Color, and we want to change it to yellow. Finally, we want to repeat that this time we do it for the property object property fill and use yellow to fill the background. So far, that’s it. If this was too fast for you or if you have no idea what all the code here does, maybe you want to watch one of the other videos in this basic video series or maybe even the Premium Course on our website might be interesting for you. For now please click on the Compile button or F7 on your keyboard.
I need to remove this additional bracket here. Now, let’s recompile the code, and this time we have no errors, and if this is true, you can click on a little button here or press F4 to go back to Metatrader. And in Metatrader, you want to click on View Strategy tester or Control and R, please pick the new file. Simple triangle dot .ex5 mark the option for the Visual mode. If you don’t see that, you might need to drag the lower part until this box becomes available.
Now let’s click on Start to start your test and now we see our triangle object is created. And it changes with every new candle because and this little video, you have learned how to create a dynamic triangle object and you have coded it yourself with a few lines of MQL5 code.
 Not sure what to do? Click on the automated trading assistant below
OR CLICK HERE TO BUY NOW

- Charting with MQL5 and ObjectCreate
- MQL5 TUTORIAL BASICS 127 - SIMPLE ELLIPSE OBJECT
- Charting a Course with MQL5 and ObjectCreate
- MQL5 TUTORIAL - SIMPLE MOUSE CLICK EVENT
- MQL5 Tutorial - Simple Chart Objects
- MQL5 TUTORIAL - SIMPLE ON BALANCE VOLUME
