

In this video we are going to create an expert advisor that is able to draw a line object from the highest price on the chart to the current high of the current candle to get the current price trend, so let’s find out how to do that with mql5.
To get started please click on this little icon here or press F4 on your keyboard, now you should see the Metaeditor window and here you want to click on file, new file, expert advisor from template, continue, I will call this file, simple high price line, click on continue, continue and finish.
Now you can delete everything above the ontick function and the two comment lines here.
As we only want to draw a line for the highest candle on the chart we just need to get the number of candles that are visible.
And to do that we use chart get integer for the current main chart and the property we need to get is called chart first visible bar – all in capital letters –, the last parameter here is for the sub-window, window zero means we use the window with the candles. If you like oscillators like the MACD you will see another window below the main window that would be window one but in our case, we will draw the line in the main chart where the candles are.
Now let’s create a variable for the highest candle, we also want to create an array that is called high to hold all the high prices for each candle on the chart. Let’s use array set as series to sort the array downwards from the current candle and now we can use a function that is called copy high, it contains the data of highest bar prices and we need to use a few parameters.
The first one is for the current symbol or the current currency pair on the chart, the second one is for the period that we are using on that chart, these two values are able to automatically detect that.
This is the starting index that’s candle zero or the current candle and we want to check all the candles on the chart that we have calculated here and store the values for the highest prices in our high array. And that makes it possible to get the highest candle by using array maximum.
Array maximum searches for the largest element in our array that is the array that we called high, it starts to search from the current candle zero and it will go through the values for all the candles on the chart and store the highest value in this variable called highest candle.
Now let’s use mql rates to get the price information for all the candles on the chart, not only the highest prices but all the prices. Mql rates stores information about prices, volumes and spread.
We call the array price information, let’s also use array set as series to sort this one from the current candle downwards and now we want to use copy rates to copy the price data for the current symbol on the chart and the currently selected period starting from candle zero for all the candles on the chart and store the results in the price information array.
And before we create an object we use object delete because if we already have drawn lines on the chart we are going to delete all the lines that are called simple high line trend for the current symbol on the chart, that will remove the old lines. And now we can use object create to create a new one that will require a few parameters, so let’s go through the values one by one.
The first parameter is for the current symbol on the chart, the second parameter is for the object name, in this case, it’s called simple high line trend, you could use any name but you need to use the same name everywhere, parameter three is called obj trend and when you mark that and press F1 you will see that this will draw a trend line, we could create lots of other object types, here is a list.
Parameter number four is for the window where we want to create the object, as I said I would like to have the line in the main window and it should start at the highest candle in our price information array and this is a point in time because we all know this is a time based and this is a value-based scale, so let’s start with the time for the highest candle and in the next parameter we will pass the value for the highest price of the highest candle, this is where the line should start.
Now let’s define our second point, this is the time for candle zero or the current time for the current candle and we want the line to be drawn through the highest price of the current candle.
That’s it for the object creation.
Now let’s change some properties! To change the object color we are going to use object set integer for the current chart and the object that is called simple high line trend, we want to change the object property color, I have used red because I want to see a red line.
In the next step, we repeat that and use object set integer for the current chart and the object called simple high line trend but this time we are going to use object property style to change the style for the line to solid, if you mark that and press F1 you will see that we can have solid lines, dotted lines and a few other styles.
Let’s change another property, this time it is object property width, I want a thin line, so I choose one and here comes an interesting property, this one is called object property ray and this is actually not working right now, let’s mark that press F1 and I think I need to use this one, this is called object property ray right, so let’s exchange that and this will cause the line to be drawn through the current candle and into the future.
Okay, that’s it.
If you have no idea what all the code here does or if this was too fast for you maybe you want to watch one of the other videos in this basic video series or maybe even the premium course on our website might be interesting for you, for now, please click on the compile button or press F7 on your keyboard that should work without any errors and if that is the case you can click on a little button here or press F4 to go back to Metatrader.
And in Metatrader we want to click on view, strategy tester or press control and r, please pick the new file, simple high price line dot ex5, mark the option for the visual mode here and start your test.
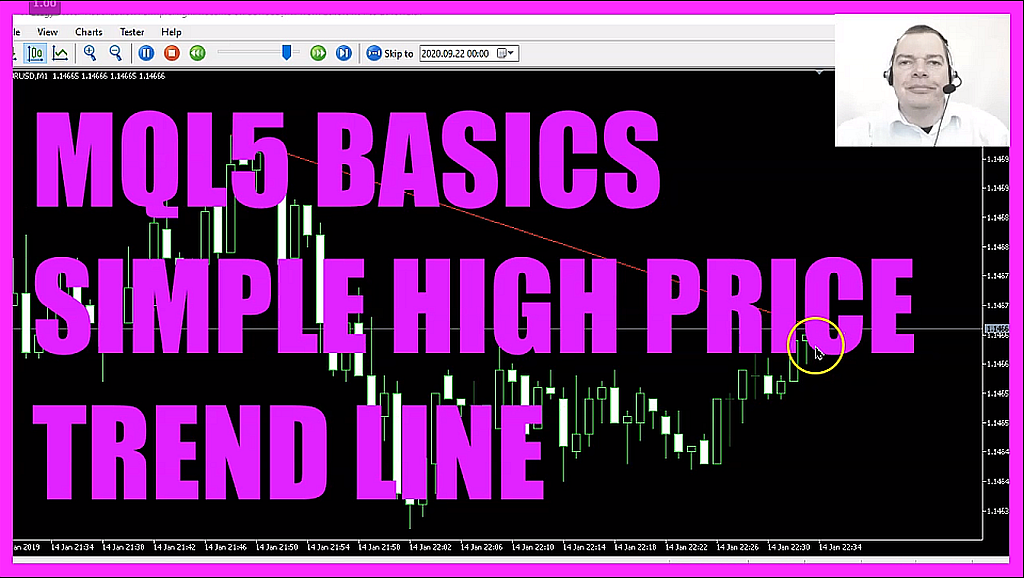
Here we are! And now you can see that the line is actually drawn through the current candle and into the future, so our little expert advisor works as designed, you can even zoom in or zoom out and it will still work and in this little video, you have learned how to create an expert advisor that is able to draw a line object from the highest candle to the current candle, right now it’s the current candle and you have coded it yourself with a few lines of mql5 code.
 Not sure what to do? Click on the automated trading assistant below
- MQL5 TUTORIAL BASICS 127 - SIMPLE ELLIPSE OBJECT
- MQL5 Tutorial - Advanced Trading Range Calculation
- MQL5 Moving Average Crossover - Build your own…
- MQL5 TUTORIAL BASICS - 117 SIMPLE MULTIPLE CHART TREND
- MQL5 TUTORIAL BASICS - 114 SIMPLE SHIFTED PRICE EA
- MQL5 Tutorial - Simple Chart Objects
