

- Introduction to Creating a Parabolic SAR Expert Advisor in MQL5 (00:00 – 00:31)
- Introduction to the tutorial on automating the Parabolic SAR indicator using MQL5.
- Opening MetaEditor and Creating a New Expert Advisor File (00:31 – 00:56)
- Instructions on opening MetaEditor and creating a new Expert Advisor file named “SimpleParabolicSAREA”.
- Setting Up the Code Structure and Including Trade.mqh (00:56 – 01:22)
- Removing unnecessary code and including the ‘Trade.mqh’ file for trading functions.
- Calculating Ask and Bid Prices (01:22 – 01:58)
- Using ‘SymbolInfoDouble’ to calculate the Ask and Bid prices and normalizing them for currency pair precision.
- Creating a Variable for the Signal and Price Array (01:58 – 02:22)
- Initializing a variable for the trading signal and creating an array for price data.
- Defining Parabolic SAR Properties and Filling the Price Array (02:22 – 03:10)
- Defining properties for the Parabolic SAR and using ‘CopyRates’ to fill the price array with data.
- Determining Buy and Sell Signals Based on Parabolic SAR (03:10 – 03:34)
- Setting conditions for buy and sell signals based on the Parabolic SAR value relative to the price.
- Executing Trades Based on Signals (03:34 – 04:09)
- Using ‘trade.Sell’ and ‘trade.Buy’ to execute trades based on the determined signals.
- Creating Chart Output for the Signal (04:09 – 04:23)
- Using the ‘Comment’ function to display the current trading signal on the chart.
- Compiling the Code and Testing in MetaTrader (04:23 – 04:48)
- Compiling the code and testing the Expert Advisor in MetaTrader using the Strategy Tester.
- Observing the Parabolic SAR EA in Action on the Chart (04:48 – 05:17)
- Watching the Expert Advisor trade the Parabolic SAR on the chart and analyzing its performance.
- Conclusion and Further Learning Resources (05:17 – 06:25)
- Conclusion of the tutorial and invitation to explore more videos and courses for further learning.
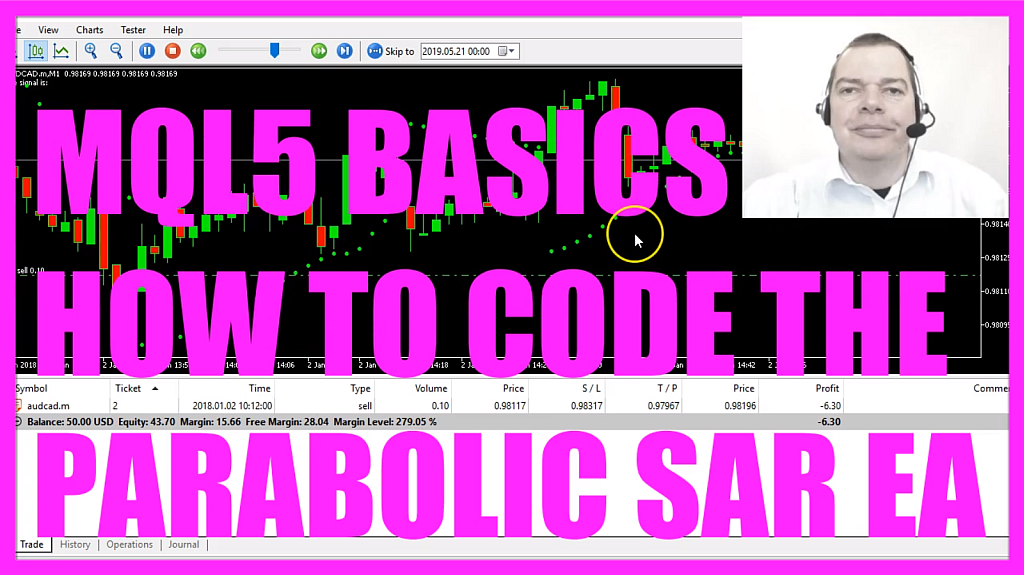
In this video, we are going to create this interesting Expert Advisor for the Parabolic SAR Indicator.
You see the little green points here, this is the signal, whenever the points are above the price that’s a sell signal and when they are below the price that’s a buy signal until the direction changes.
So let’s find out how to automate the Parabolic SAR with MQL5.
To do that please click on a little button here or press F4 on your keyboard, now you should see the Metaeditor window and here you want to click on: “File/ New File/ Expert Advisor (template)” from template, “Continue”, I will call this file: “SimpleParabolicSAREA”, click on “Continue”, “Continue” and “Finish”.
Now you can remove everything above the “OnTick” function and the two comment lines here.
We start with an include statement to include the file: “Trade.mqh”, this one is included in MQL5 and it comes with trading functions that we are going to use to open our positions, so let’s create an instance of “CTrade” that will be called: “trade” and we are going to use it later.
Inside of the “OnTick” function we start by calculating the Ask price and the Bid price that is done by using “SymbolInfoDouble” for the current symbol on the chart, with “SYMBOL_ASK” – all in capital letters – we will get the Ask price and with “SYMBOL_BID” we would get the Bid price. “NormalizeDouble” and “_Digits” is used to calculate the number of digits behind the dot because “_Digits” stores the number of digits after the decimal point and depending on the currency pair that can be 3 digits or 5 digits.
Let’s create a variable for the signal we will also call it “signal” and we don’t assign a value, that is going to be calculated later on.
First we need to create a price array for the prices on the chart that is done with “MqlRates”, we use “ArraySetAsSeries” for our price array (PriceArray) to sort it from the current candle downwards and now we need to fill the array (PriceArray) with price data hat is done by using “CopyRates” for the current symbol on the chart and the currently selected period.
By the way “_Symbol” and this symbol (Symbol()) is the same so we also could use “_Symbol” and the same is true for “_Period”, we start with the current candle 0 (zero) and we want to get the price data for 3 candles and store it in our price array (PriceArray).
Let’s create another array (mySARArray) for the Parabolic SAR Indicator, let’s define (SARDefinition) what we are going to do, we use the “iSAR” function that comes with MQL5 for the current symbol on the chart and the currently selected period. So let’s find out about these two values here.
Pick any chart, click on: “Insert/ Indicators/ Trend/ Parabolic SAR” and here we see we have a step value of 0.02 and a max value of 0.2, so let’s click on “OK”, now you see the Indicator and we want to right-click on the chart, select “Templates/ Save Template” and save it as “tester.tpl”, yes I want to exchange the current one because if I don’t do that I might not see the Indicator in the backtest, but back to the code here are the two values; the step value and the max value, lets also sort this array (mySARArray) by using “ArraySetAsSeries” and this time we use “CopyBuffer” to fill our price array (mySARArray) according to the SAR definition (SARDefinition) that we have created here for the 0 (zero) buffer – that’s the only buffer this Indicator has – from candle 0 (zero) – that’s the current candle – for 3 candles and store the values in the SAR array (mySARArray).
Now we can get the last SAR value (LastSARValue) by looking into candle 1 from the SAR array (mySARArray). I use “NormalizeDouble” and 5 digits because this is what you see when you point your mouse over one of those Indicator dots, we have 5 digits behind the dot.
So let’s find out if we have a buy signal and that would be if the last SAR value (LastSARValue) is below the law of candle 1 in our price array (PriceArray) or in other words if the dot is below the candle we assign the word: “buy” to our signal.
In the other case, a sell signal would be if the last SAR value (LastSARValue) is above the highest price of candle 1 in our price array (PriceArray) and if that is the case we assign the word: “sell” to our signal.
So if our signal equals sell and “PositionsTotal” is below 1 – in other words, we don’t have any open position – we use “trade.Sell” to sell 10 micro lot, otherwise, if the signal equals buy and we have no open positions we use “trade.Buy” and buy 10 micro lot.
Finally, we want to create a chart output by using the “Comment” statement. This will output the text: “The signal is:” followed by the current signal.
If you don’t know what all the code does or if I was a little bit fast for you maybe you want to watch the other videos in this basic video series or maybe even the premium course might be interesting for you.
Otherwise please click on the “Compile” button here and if you don’t get any errors you can click on the little button here or press F4 to go back to Metatrader.
In Metatrader we click on: “View/ Strategy Tester” or press CTRL and R, here we pick the Simple Parabolic SAR EA (SimpleParabolicSAREA.ex5), mark the visualization option and start a test.
…and here is our little Expert Advisor in our backtest, we already have a buy position here because the price was above the dots and now you know how to code an Expert Advisor to calculate the Parabolic SAR Indicator and you have coded it yourself with a few lines of MQL5 code.
- Introduction to Parabolic SAR Expert Advisor (00:00 – 00:16)
- Overview of creating an Expert Advisor for the parabolic SAR.
- Explanation of how the parabolic SAR indicates direction changes.
- Understanding Parabolic SAR Indicator (00:16 – 00:30)
- Description of the parabolic SAR’s behavior in relation to price movements.
- Creating the Expert Advisor in MQL5 (00:30 – 00:57)
- Initial steps to create an Expert Advisor for calculating the SAR value.
- Setting Up the Expert Advisor (00:57 – 01:12)
- Instructions on setting up the Expert Advisor in the Meta Editor.
- Defining the SAR Array and Properties (01:12 – 01:35)
- Creating the SAR array and defining its properties.
- Reference to the parabolic SAR on Wikipedia.
- Configuring SAR Parameters (01:35 – 02:12)
- Explanation of the parabolic SAR parameters and their configuration.
- Implementing the iSAR Function (02:12 – 02:45)
- Using the iSAR function for the current symbol and selected period.
- Sorting the price array with the arraysetasseries function.
- Filling the SAR Array with Data (02:45 – 03:15)
- Filling the SAR array with data for the defined SAR.
- Calculating and Displaying the SAR Value (03:15 – 03:53)
- Calculating the SAR value for the current candle.
- Displaying the SAR value on the chart.
- Compiling and Testing the Expert Advisor (03:53 – 04:20)
- Compiling the Expert Advisor and launching the Metatrader for testing.
- Visualizing and Analyzing SAR Indicator (04:20 – 04:55)
- Activating the strategy tester and analyzing the SAR indicator’s behavior.
- Conclusion and Application (04:55 – 05:28)
- Observing the SAR indicator’s values and their application in automated trading systems.
 Not sure what to do? Click on the automated trading assistant below
- MQL5 TUTORIAL - SIMPLE SAR STOCHASTIC STANDALONE…
- How to create a simple SAR Expert Advisor with MQL5
- MQL5 TUTORIAL - HOW TO CREATE THE BOLLINGER BANDS…
- MQL5 TUTORIAL - SIMPLE IVIDYA STANDALONE EXPERT ADVISOR
- How to combine the Parabolic SAR and the Stochastic…
- MQL5 TUTORIAL - SIMPLE ITRIX STANDALONE EXPERT ADVISOR
